

signal strength 3 of 5
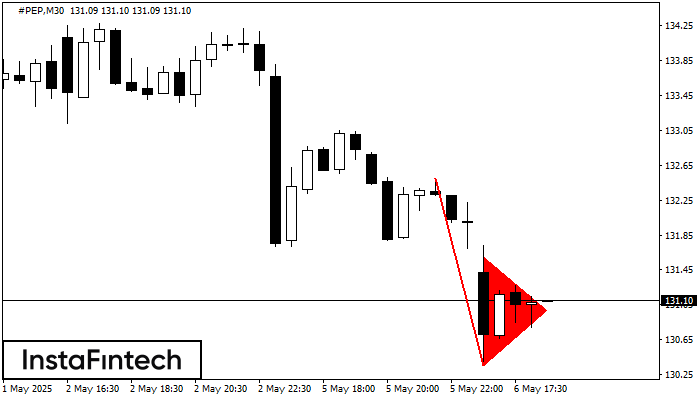
The Bearish pennant pattern has formed on the #PEP M30 chart. It signals potential continuation of the existing trend. Specifications: the pattern’s bottom has the coordinate of 130.36; the projection of the flagpole height is equal to 214 pips. In case the price breaks out the pattern’s bottom of 130.36, the downtrend is expected to continue for further level 130.06.
আরও দেখুন
- All
- Double Top
- Flag
- Head and Shoulders
- Pennant
- Rectangle
- Triangle
- Triple top
- All
- #AAPL
- #AMZN
- #Bitcoin
- #EBAY
- #FB
- #GOOG
- #INTC
- #KO
- #MA
- #MCD
- #MSFT
- #NTDOY
- #PEP
- #TSLA
- #TWTR
- AUDCAD
- AUDCHF
- AUDJPY
- AUDUSD
- EURCAD
- EURCHF
- EURGBP
- EURJPY
- EURNZD
- EURRUB
- EURUSD
- GBPAUD
- GBPCHF
- GBPJPY
- GBPUSD
- GOLD
- NZDCAD
- NZDCHF
- NZDJPY
- NZDUSD
- SILVER
- USDCAD
- USDCHF
- USDJPY
- USDRUB
- All
- M5
- M15
- M30
- H1
- D1
- All
- Buy
- Sale
- All
- 1
- 2
- 3
- 4
- 5
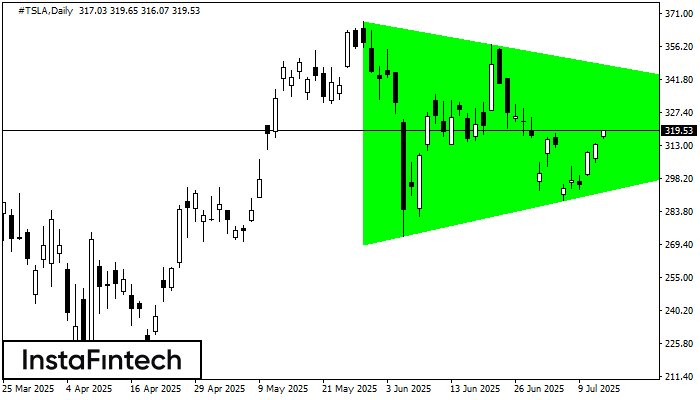
D1 চার্ট অনুযায়ী, #TSLA বুলিশ সিমেট্রিকাল ট্রায়াঙ্গেল প্যাটার্ন গঠন করেছে। বর্ণনা: এটি একটি ধারাবাহিক প্রবণতার প্যাটার্ন। 367.40 এবং 269.16 হল যথাক্রমে উপরের এবং নীচের সীমানার কোঅর্ডিনেট। চার্টে প্যাটার্নের প্রস্থ 9824
Open chart in a new window
D1 চার্ট অনুযায়ী, #TSLA বুলিশ সিমেট্রিকাল ট্রায়াঙ্গেল প্যাটার্ন গঠন করেছে। প্যাটার্নের নীচের সীমানা 269.16/323.26-এর কোঅর্ডিনেটগুলো স্পর্শ করেছে যেখানে উপরের সীমানাটি 367.40/323.26 জুড়ে যাচ্ছে৷ যদি বুলিশ সিমেট্রিকাল ট্রায়াঙ্গেল প্যাটার্নটি বজায় থাকে
Open chart in a new window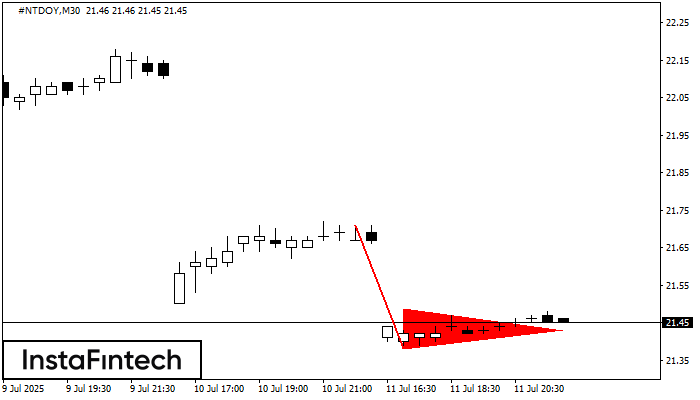
M30 চার্টে #NTDOY-এর বিয়ারিশ পেন্যান্ট প্যাটার্ন গঠিত হয়েছে৷ পেন্যান্টের সর্বনিম্ন 21.38 ব্রেক করার ক্ষেত্রে, এই প্যাটার্ন নিম্নমুখী প্রবণতার ধারাবাহিকতা নির্দেশ করে। পরামর্শ: এই প্যাটার্নের সর্বনিম্ন স্তরের 10 পিপস নীচে পেন্ডিং
Open chart in a new window


