empty
сформирован 26.06 в 20:37:27 (UTC+0)
сила сигнала 1 из 5
Бычий симметричный треугольник EURGBP M5

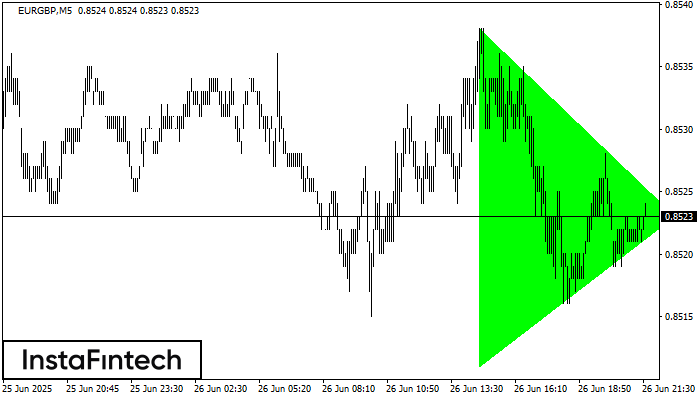
По EURGBP на M5 сформировалась фигура «Бычий симметричный треугольник». Нижняя граница фигуры имеет координаты 0.8511/0.8523, при этом верхняя граница 0.8538/0.8523. Формирование фигуры «Бычий симметричный треугольник» наиболее вероятным образом свидетельствует о продолжении восходящего тренда. Это означает, что курс EURGBP, в случае срабатывания фигуры, пробьет верхнюю границу и направится к значению 0.8538.

Таймфреймы М5 и М15 могут иметь больше ложных точек входа.

Шунингдек кўринг

Фигура
  • Все
  • Вымпел
  • Голова и плечи
  • Двойная вершина
  • Прямоугольник
  • Треугольник
  • Тройная вершина
  • Флаг
Инструмент
  • Все
  • #AAPL
  • #AMZN
  • #Bitcoin
  • #EBAY
  • #FB
  • #GOOG
  • #INTC
  • #KO
  • #MA
  • #MCD
  • #MSFT
  • #NTDOY
  • #PEP
  • #TSLA
  • #TWTR
  • AUDCAD
  • AUDCHF
  • AUDJPY
  • AUDUSD
  • EURCAD
  • EURCHF
  • EURGBP
  • EURJPY
  • EURNZD
  • EURRUB
  • EURUSD
  • GBPAUD
  • GBPCHF
  • GBPJPY
  • GBPUSD
  • GOLD
  • NZDCAD
  • NZDCHF
  • NZDJPY
  • NZDUSD
  • SILVER
  • USDCAD
  • USDCHF
  • USDJPY
  • USDRUB
Таймфрейм
  • Все
  • M5
  • M15
  • M30
  • H1
  • D1
Тренд
  • Все
  • Покупка
  • Продажа
Сила сигнала
  • Все
  • 1
  • 2
  • 3
  • 4
  • 5
Double Top
was formed on 01.08 at 17:49:39 (UTC+0)
signal strength 1 of 5
Double Top #PEP M5

On the chart of #PEP M5 the Double Top reversal pattern has been formed. Characteristics: the upper boundary 139.76; the lower boundary 138.27; the width of the pattern 149 points

The M5 and M15 time frames may have more false entry points.

Open chart in a new window
Bullish Rectangle
was formed on 01.08 at 17:22:56 (UTC+0)
signal strength 1 of 5
Bullish Rectangle GBPAUD M5

According to the chart of M5, GBPAUD formed the Bullish Rectangle. The pattern indicates a trend continuation. The upper border is 2.0535, the lower border is 2.0504. The signal means

The M5 and M15 time frames may have more false entry points.

Open chart in a new window
Bearish Symmetrical Triangle
was formed on 01.08 at 17:22:40 (UTC+0)
signal strength 1 of 5
Bearish Symmetrical Triangle AUDCAD M5

According to the chart of M5, AUDCAD formed the Bearish Symmetrical Triangle pattern. Trading recommendations: A breach of the lower border 0.8897 is likely to encourage a continuation

The M5 and M15 time frames may have more false entry points.

Open chart in a new window
Ҳозир телефон орқали гаплаша олмайсизми?
Саволингизни беринг чатда.
Обратный звонок
 

Dear visitor,

Your IP address shows that you are currently located in the USA. If you are a resident of the United States, you are prohibited from using the services of InstaFintech Group including online trading, online transfers, deposit/withdrawal of funds, etc.

If you think you are seeing this message by mistake and your location is not the US, kindly proceed to the website. Otherwise, you must leave the website in order to comply with government restrictions.

Why does your IP address show your location as the USA?

  • - you are using a VPN provided by a hosting company based in the United States;
  • - your IP does not have proper WHOIS records;
  • - an error occurred in the WHOIS geolocation database.

Please confirm whether you are a US resident or not by clicking the relevant button below. If you choose the wrong option, being a US resident, you will not be able to open an account with InstaForex anyway.

We are sorry for any inconvenience caused by this message.