empty
08.05.2023 10:39 PM
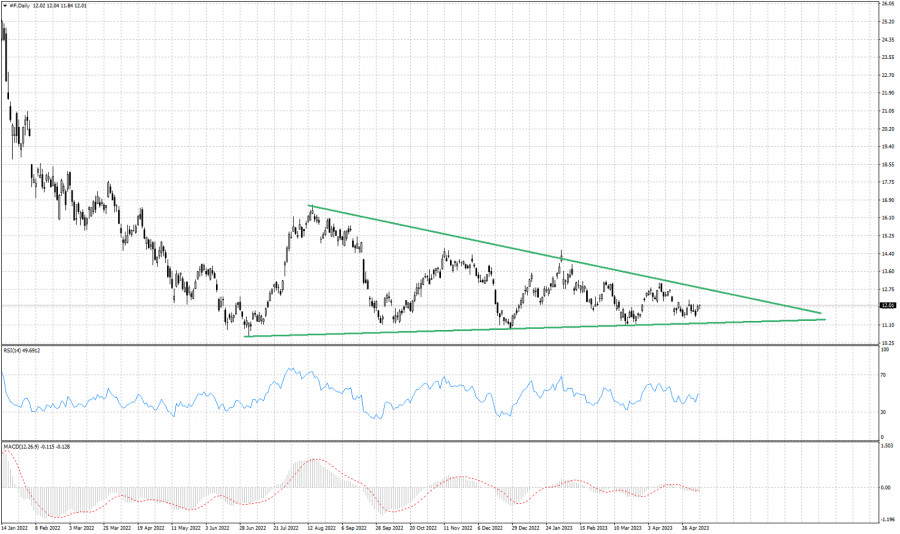
Ford stock price continues to trade inside a triangle pattern since last year.

This image is no longer relevant

Green lines- triangle pattern

Over the last 9 months, Ford's stock price has been trading in a relatively narrow range between $7.50 and $12.50. During this period, the stock has formed a triangle pattern on the daily chart, with the upper trendline connecting the highs and the lower trendline connecting the lows. The triangle pattern suggests that Ford's stock price is consolidating and that a breakout may be imminent. If the stock breaks above the upper trendline, it could signal a bullish continuation and a potential move towards the $13.50 to $14.00 range. On the other hand, if price breaks below the lower trendline, it could signal a bearish reversal and a potential move towards the $6.50 to $7.00 range. The Relative Strength Index (RSI) is currently hovering around the midpoint, indicating that the stock is neither overbought nor oversold. The Moving Average Convergence Divergence (MACD) indicator is also showing a neutral signal, with the MACD line and signal line crossing each other multiple times over the past few months. Overall, the technical outlook for Ford's stock price remains uncertain as it continues to trade within the triangle pattern. Traders and investors should keep a close eye on the upper and lower trendlines for potential breakout signals.

Summary
Urgency
Analytic
Alexandros Yfantis
Start trade
Gana con los cambios en el valor de las criptomonedas con InstaForex.
Descarga MetaTrader 4 y abre tu primera operación.
  • Grand Choice
    Contest by
    InstaForex
    InstaForex always strives to help you
    fulfill your biggest dreams.
    UNIRSE AL CONCURSO

Recommended Stories

El mercado bursátil para el 13 de agosto: el S&P500 y el NASDAQ subieron con fuerza tras las estadísticas de inflación

Al cierre de ayer, los índices bursátiles estadounidenses terminaron al alza. El S&P 500 subió un 1,13% y el Nasdaq 100 saltó un 1,39%. El industrial Dow Jones ganó

Jakub Novak 13:17 2025-08-13 UTC+2

Mercado bursátil al 11 de agosto: SP500 y NASDAQ vuelven a subir

Al cierre del pasado viernes, los índices bursátiles estadounidenses terminaron al alza. El S&P 500 subió un 0,78%, mientras que el Nasdaq 100 ganó un 0,97%. El industrial Dow Jones

Jakub Novak 07:36 2025-08-11 UTC+2

Mercado bursátil el 4 de agosto: SP500 y NASDAQ se desplomaron

Al cierre del día de ayer, los índices bursátiles estadounidenses terminaron con caídas. El S&P 500 cayó un 1,60 %, mientras que el Nasdaq 100 perdió un 2,24 %

Jakub Novak 11:26 2025-08-04 UTC+2

Mercado bursátil a 30 de julio: el SP500 y el NASDAQ continúan la corrección

Al cierre del pasado viernes, los índices bursátiles estadounidenses terminaron a la baja. El S&P 500 cayó un 0,30%, y el Nasdaq 100 descendió un 0,30%. El industrial Dow Jones

Jakub Novak 09:34 2025-07-30 UTC+2

El desenlace del verano. ¿Podrá el S&P 500 romper los 6500 o comenzará la tan esperada corrección?

Los índices estadounidenses continúan haciendo historia: en el premercado del martes, el S&P 500 ya se cotiza en 6400, y el Nasdaq 100 supera los 23470. Uno pensaría, ¿a dónde

Anna Zotova 12:46 2025-07-29 UTC+2

Mercado bursátil el 29 de julio: SP500 y NASDAQ mostraron una corrección

Al cierre del pasado viernes, los índices bursátiles estadounidenses registraron resultados mixtos. El S&P 500 subió un 0,02%, mientras que el Nasdaq 100 ganó un 0,33%. El índice industrial

Jakub Novak 12:45 2025-07-29 UTC+2

Mercado bursátil el 28 de julio: SP500 y NASDAQ renovaron máximos históricos

Al cierre del pasado viernes, los índices bursátiles estadounidenses terminaron con subidas. El S&P 500 subió un 0,40%, y el Nasdaq 100 ganó un 0,20%. El índice industrial Dow Jones

Jakub Novak 12:00 2025-07-28 UTC+2

Mercado bursátil el 17 de julio: el SP500 y el NASDAQ se alegraron por los rumores sobre Powell

Al cierre de la jornada de ayer, los índices bursátiles estadounidenses cerraron al alza. El S&P 500 subió un 0,32 % y el Nasdaq 100 ganó un 0,25 %

Jakub Novak 10:11 2025-07-17 UTC+2

Mercado estadounidense: Estancamiento bajo el nivel de 6300 del S&P500

S&P500 Análisis 17.07 Mercado estadounidense: Estancamiento bajo 6300 del S&P500 Principales índices de EE. UU. el miércoles: Dow +0.5% NASDAQ +0.3% S&P500 +0.3% S&P500 6263 rango 5900 - 6400

Jozef Kovach 09:54 2025-07-17 UTC+2

Mercado bursátil el 16 de julio: el SP500 y el NASDAQ cayeron rápidamente ante los nuevos aranceles de Trump

Al cierre de la jornada de ayer, los índices bursátiles estadounidenses cerraron con resultados dispares. El S&P 500 cayó un 0,40 %, mientras que el Nasdaq 100 subió un 0,19

Jakub Novak 11:50 2025-07-16 UTC+2
¿No puede hablar ahora mismo?
Ingrese su pregunta en el chat.
Widget callback
 

Dear visitor,

Your IP address shows that you are currently located in the USA. If you are a resident of the United States, you are prohibited from using the services of InstaFintech Group including online trading, online transfers, deposit/withdrawal of funds, etc.

If you think you are seeing this message by mistake and your location is not the US, kindly proceed to the website. Otherwise, you must leave the website in order to comply with government restrictions.

Why does your IP address show your location as the USA?

  • - you are using a VPN provided by a hosting company based in the United States;
  • - your IP does not have proper WHOIS records;
  • - an error occurred in the WHOIS geolocation database.

Please confirm whether you are a US resident or not by clicking the relevant button below. If you choose the wrong option, being a US resident, you will not be able to open an account with InstaForex anyway.

We are sorry for any inconvenience caused by this message.