signal strength 4 of 5

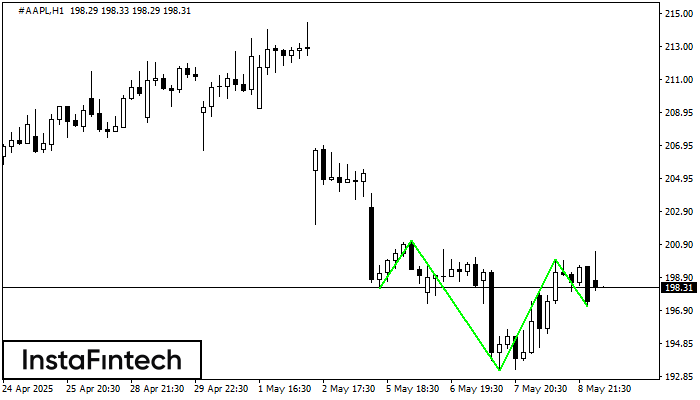
According to the chart of H1, #AAPL formed the Inverse Head and Shoulder pattern. The Head’s top is set at 200.00 while the median line of the Neck is found at 193.24/197.13. The formation of the Inverse Head and Shoulder pattern evidently signals a reversal of the downward trend. In other words, in case the scenario comes true, the price of #AAPL will go towards 200.40
- All
- Double Top
- Flag
- Head and Shoulders
- Pennant
- Rectangle
- Triangle
- Triple top
- All
- #AAPL
- #AMZN
- #Bitcoin
- #EBAY
- #FB
- #GOOG
- #INTC
- #KO
- #MA
- #MCD
- #MSFT
- #NTDOY
- #PEP
- #TSLA
- #TWTR
- AUDCAD
- AUDCHF
- AUDJPY
- AUDUSD
- EURCAD
- EURCHF
- EURGBP
- EURJPY
- EURNZD
- EURRUB
- EURUSD
- GBPAUD
- GBPCHF
- GBPJPY
- GBPUSD
- GOLD
- NZDCAD
- NZDCHF
- NZDJPY
- NZDUSD
- SILVER
- USDCAD
- USDCHF
- USDJPY
- USDRUB
- All
- M5
- M15
- M30
- H1
- D1
- All
- Buy
- Sale
- All
- 1
- 2
- 3
- 4
- 5
The Double Bottom pattern has been formed on USDJPY M5. Characteristics: the support level 144.13; the resistance level 144.33; the width of the pattern 20 points. If the resistance level
The M5 and M15 time frames may have more false entry points.
Open chart in a new windowThe Double Bottom pattern has been formed on NZDJPY M15; the upper boundary is 87.17; the lower boundary is 87.02. The width of the pattern is 14 points. In case
The M5 and M15 time frames may have more false entry points.
Open chart in a new windowThe Triple Bottom pattern has been formed on AUDCHF M5. It has the following characteristics: resistance level 0.5340/0.5335; support level 0.5331/0.5332; the width is 9 points. In the event
The M5 and M15 time frames may have more false entry points.
Open chart in a new window