

was formed on 21.11 at 09:45:18 (UTC+0)
signal strength 3 of 5
signal strength 3 of 5
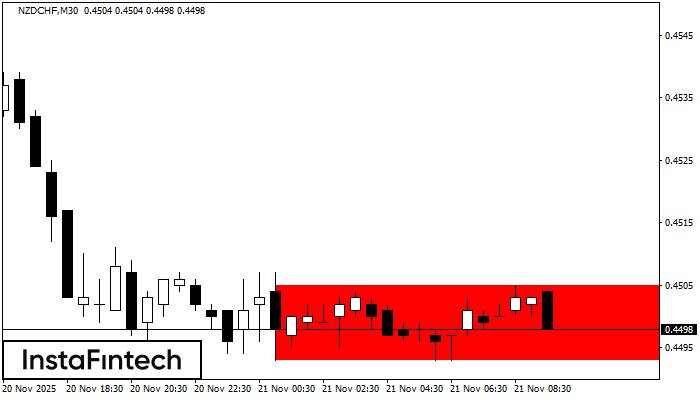
According to the chart of M30, NZDCHF formed the Bearish Rectangle which is a pattern of a trend continuation. The pattern is contained within the following borders: lower border 0.4493 – 0.4493 and upper border 0.4505 – 0.4505. In case the lower border is broken, the instrument is likely to follow the downward trend.
Figure
Instrument
Timeframe
Trend
Signal Strength


