signal strength 4 of 5

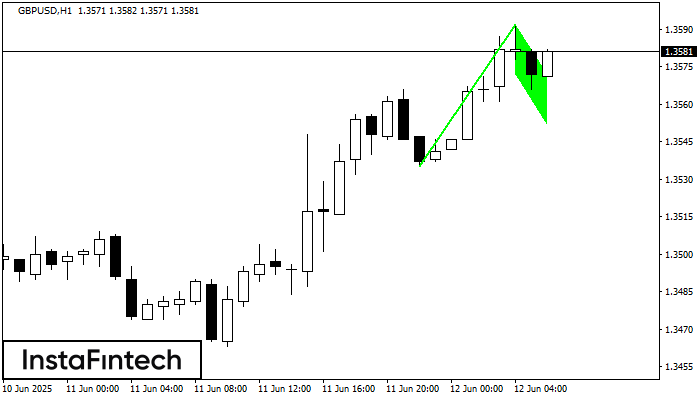
The Bullish Flag pattern which signals continuation of a trend has been formed on the chart GBPUSD H1. Forecast: if the price breaks above the pattern high at 1.3592, then traders will be able to place a long deal with the target at 1.3632.
See Also
- All
- Double Top
- Flag
- Head and Shoulders
- Pennant
- Rectangle
- Triangle
- Triple top
- All
- #AAPL
- #AMZN
- #Bitcoin
- #EBAY
- #FB
- #GOOG
- #INTC
- #KO
- #MA
- #MCD
- #MSFT
- #NTDOY
- #PEP
- #TSLA
- #TWTR
- AUDCAD
- AUDCHF
- AUDJPY
- AUDUSD
- EURCAD
- EURCHF
- EURGBP
- EURJPY
- EURNZD
- EURRUB
- EURUSD
- GBPAUD
- GBPCHF
- GBPJPY
- GBPUSD
- GOLD
- NZDCAD
- NZDCHF
- NZDJPY
- NZDUSD
- SILVER
- USDCAD
- USDCHF
- USDJPY
- USDRUB
- All
- M5
- M15
- M30
- H1
- D1
- All
- Buy
- Sale
- All
- 1
- 2
- 3
- 4
- 5
According to the chart of M5, GBPUSD formed the Bullish Rectangle. This type of a pattern indicates a trend continuation. It consists of two levels: resistance 1.3346 and support 1.3336
The M5 and M15 time frames may have more false entry points.
Open chart in a new windowThe Double Top pattern has been formed on GBPUSD M5. It signals that the trend has been changed from upwards to downwards. Probably, if the base of the pattern 1.3337
The M5 and M15 time frames may have more false entry points.
Open chart in a new windowThe Double Top pattern has been formed on GBPCHF M15. It signals that the trend has been changed from upwards to downwards. Probably, if the base of the pattern 1.0727
The M5 and M15 time frames may have more false entry points.
Open chart in a new window