signal strength 1 of 5

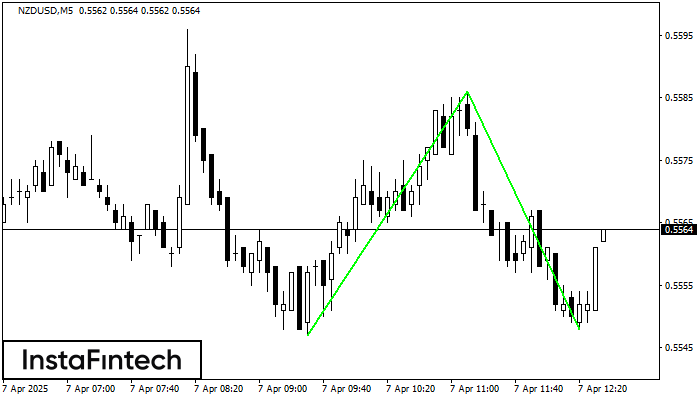
The Double Bottom pattern has been formed on NZDUSD M5. This formation signals a reversal of the trend from downwards to upwards. The signal is that a buy trade should be opened after the upper boundary of the pattern 0.5586 is broken. The further movements will rely on the width of the current pattern 39 points.
The M5 and M15 time frames may have more false entry points.
- All
- Double Top
- Flag
- Head and Shoulders
- Pennant
- Rectangle
- Triangle
- Triple top
- All
- #AAPL
- #AMZN
- #Bitcoin
- #EBAY
- #FB
- #GOOG
- #INTC
- #KO
- #MA
- #MCD
- #MSFT
- #NTDOY
- #PEP
- #TSLA
- #TWTR
- AUDCAD
- AUDCHF
- AUDJPY
- AUDUSD
- EURCAD
- EURCHF
- EURGBP
- EURJPY
- EURNZD
- EURRUB
- EURUSD
- GBPAUD
- GBPCHF
- GBPJPY
- GBPUSD
- GOLD
- NZDCAD
- NZDCHF
- NZDJPY
- NZDUSD
- SILVER
- USDCAD
- USDCHF
- USDJPY
- USDRUB
- All
- M5
- M15
- M30
- H1
- D1
- All
- Buy
- Sale
- All
- 1
- 2
- 3
- 4
- 5
According to the chart of M5, #Bitcoin formed the Bullish Rectangle. The pattern indicates a trend continuation. The upper border is 106138.63, the lower border is 105867.53. The signal means
The M5 and M15 time frames may have more false entry points.
Open chart in a new windowOn the chart of #Bitcoin M5 the Double Top reversal pattern has been formed. Characteristics: the upper boundary 106138.63; the lower boundary 105867.53; the width of the pattern 27110 points
The M5 and M15 time frames may have more false entry points.
Open chart in a new windowAccording to the chart of M5, EURCHF formed the Bearish Rectangle. This type of a pattern indicates a trend continuation. It consists of two levels: resistance 0.9344 - 0.0000
The M5 and M15 time frames may have more false entry points.
Open chart in a new window