empty
was formed on 01.04 at 16:29:44 (UTC+0)
signal strength 3 of 5
Double Top #KO M30

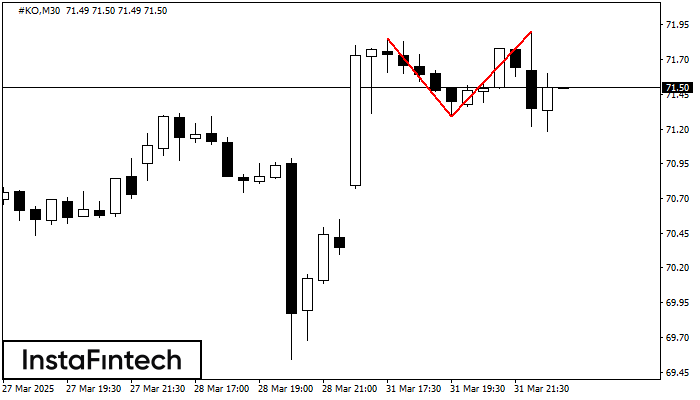
The Double Top reversal pattern has been formed on #KO M30. Characteristics: the upper boundary 71.85; the lower boundary 71.29; the width of the pattern is 61 points. Sell trades are better to be opened below the lower boundary 71.29 with a possible movements towards the 70.99 level.

See Also

Figure
  • All
  • Double Top
  • Flag
  • Head and Shoulders
  • Pennant
  • Rectangle
  • Triangle
  • Triple top
Instrument
  • All
  • #AAPL
  • #AMZN
  • #Bitcoin
  • #EBAY
  • #FB
  • #GOOG
  • #INTC
  • #KO
  • #MA
  • #MCD
  • #MSFT
  • #NTDOY
  • #PEP
  • #TSLA
  • #TWTR
  • AUDCAD
  • AUDCHF
  • AUDJPY
  • AUDUSD
  • EURCAD
  • EURCHF
  • EURGBP
  • EURJPY
  • EURNZD
  • EURRUB
  • EURUSD
  • GBPAUD
  • GBPCHF
  • GBPJPY
  • GBPUSD
  • GOLD
  • NZDCAD
  • NZDCHF
  • NZDJPY
  • NZDUSD
  • SILVER
  • USDCAD
  • USDCHF
  • USDJPY
  • USDRUB
Timeframe
  • All
  • M5
  • M15
  • M30
  • H1
  • D1
Trend
  • All
  • Buy
  • Sale
Signal Strength
  • All
  • 1
  • 2
  • 3
  • 4
  • 5
Banderín bajista
was formed on 28.05 at 08:12:58 (UTC+0)
signal strength 1 of 5
Banderín bajista GBPJPY M5

El patrón Banderín bajista se ha formado en el gráfico GBPJPY M5. Esto señala la continuación potencial de la tendencia existente. Especificaciones: el piso del patrón tiene la coordinada

Los marcos de tiempo M5 y M15 pueden tener más puntos de entrada falsos.

Open chart in a new window
Triángulo Simétrico Alcista
was formed on 28.05 at 07:55:36 (UTC+0)
signal strength 1 of 5
Triángulo Simétrico Alcista GBPAUD M5

Según el gráfico de M5, GBPAUD formó el patrón Triángulo Simétrico Alcista, que señala que la tendencia continuará. Descripción. El límite superior del patrón toca las coordenadas 2.0988/2.0939 donde

Los marcos de tiempo M5 y M15 pueden tener más puntos de entrada falsos.

Open chart in a new window
Triángulo Simétrico Bajista
was formed on 28.05 at 07:55:12 (UTC+0)
signal strength 1 of 5
Triángulo Simétrico Bajista NZDJPY M5

Según el gráfico de M5, el NZDJPY formó el patrón Triángulo Simétrico Bajista. Descripción: El límite inferior es 85.44/85.92 y el límite superior es 86.64/85.92. El ancho del patrón

Los marcos de tiempo M5 y M15 pueden tener más puntos de entrada falsos.

Open chart in a new window
Can't speak right now?
Ask your question in the chat.
Widget callback
 

Dear visitor,

Your IP address shows that you are currently located in the USA. If you are a resident of the United States, you are prohibited from using the services of InstaFintech Group including online trading, online transfers, deposit/withdrawal of funds, etc.

If you think you are seeing this message by mistake and your location is not the US, kindly proceed to the website. Otherwise, you must leave the website in order to comply with government restrictions.

Why does your IP address show your location as the USA?

  • - you are using a VPN provided by a hosting company based in the United States;
  • - your IP does not have proper WHOIS records;
  • - an error occurred in the WHOIS geolocation database.

Please confirm whether you are a US resident or not by clicking the relevant button below. If you choose the wrong option, being a US resident, you will not be able to open an account with InstaForex anyway.

We are sorry for any inconvenience caused by this message.