signal strength 4 of 5

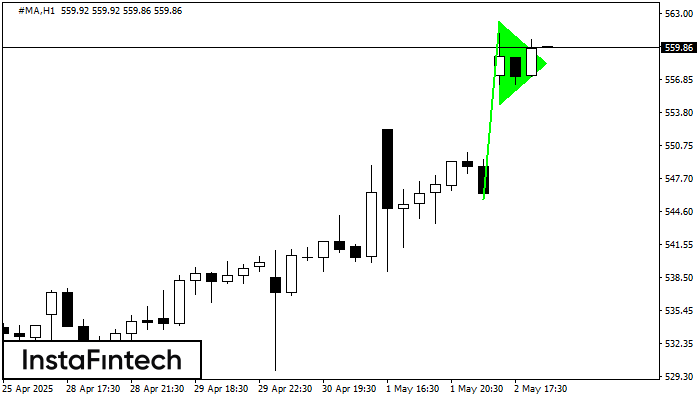
The Bullish pennant graphic pattern has formed on the #MA H1 instrument. This pattern type falls under the category of continuation patterns. In this case, if the quote can breaks out high, is expected to continue the upward trend to level 562.67.
See Also
- All
- Double Top
- Flag
- Head and Shoulders
- Pennant
- Rectangle
- Triangle
- Triple top
- All
- #AAPL
- #AMZN
- #Bitcoin
- #EBAY
- #FB
- #GOOG
- #INTC
- #KO
- #MA
- #MCD
- #MSFT
- #NTDOY
- #PEP
- #TSLA
- #TWTR
- AUDCAD
- AUDCHF
- AUDJPY
- AUDUSD
- EURCAD
- EURCHF
- EURGBP
- EURJPY
- EURNZD
- EURRUB
- EURUSD
- GBPAUD
- GBPCHF
- GBPJPY
- GBPUSD
- GOLD
- NZDCAD
- NZDCHF
- NZDJPY
- NZDUSD
- SILVER
- USDCAD
- USDCHF
- USDJPY
- USDRUB
- All
- M5
- M15
- M30
- H1
- D1
- All
- Buy
- Sale
- All
- 1
- 2
- 3
- 4
- 5
According to the chart of M5, AUDJPY formed the Bearish Symmetrical Triangle pattern. Trading recommendations: A breach of the lower border 92.44 is likely to encourage a continuation
The M5 and M15 time frames may have more false entry points.
Open chart in a new windowThe Double Top pattern has been formed on #TSLA M15. It signals that the trend has been changed from upwards to downwards. Probably, if the base of the pattern 348.76
The M5 and M15 time frames may have more false entry points.
Open chart in a new windowThe Double Top reversal pattern has been formed on #TSLA M15. Characteristics: the upper boundary 354.27; the lower boundary 348.76; the width of the pattern is 593 points. Sell trades
The M5 and M15 time frames may have more false entry points.
Open chart in a new window