


signal strength 1 of 5
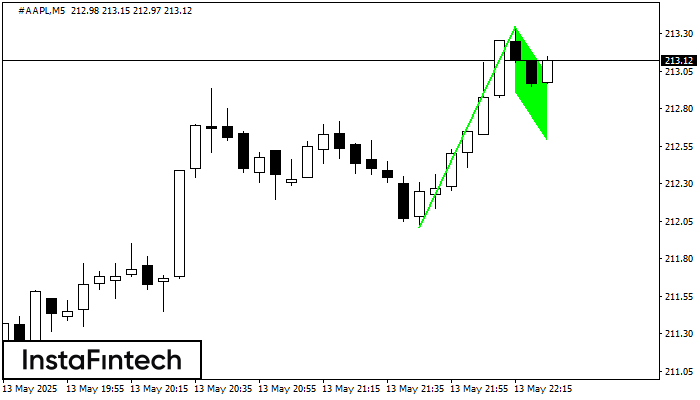
The Bullish Flag pattern has been formed on #AAPL at M5. The lower boundary of the pattern is located at 212.91/212.59, while the higher boundary lies at 213.35/213.03. The projection of the flagpole is 134 points. This formation signals that the upward trend is most likely to continue. Therefore, if the level of 213.35 is broken, the price will move further upwards.
The M5 and M15 time frames may have more false entry points.
See Also
- All
- Double Top
- Flag
- Head and Shoulders
- Pennant
- Rectangle
- Triangle
- Triple top
- All
- #AAPL
- #AMZN
- #Bitcoin
- #EBAY
- #FB
- #GOOG
- #INTC
- #KO
- #MA
- #MCD
- #MSFT
- #NTDOY
- #PEP
- #TSLA
- #TWTR
- AUDCAD
- AUDCHF
- AUDJPY
- AUDUSD
- EURCAD
- EURCHF
- EURGBP
- EURJPY
- EURNZD
- EURRUB
- EURUSD
- GBPAUD
- GBPCHF
- GBPJPY
- GBPUSD
- GOLD
- NZDCAD
- NZDCHF
- NZDJPY
- NZDUSD
- SILVER
- USDCAD
- USDCHF
- USDJPY
- USDRUB
- All
- M5
- M15
- M30
- H1
- D1
- All
- Buy
- Sale
- All
- 1
- 2
- 3
- 4
- 5
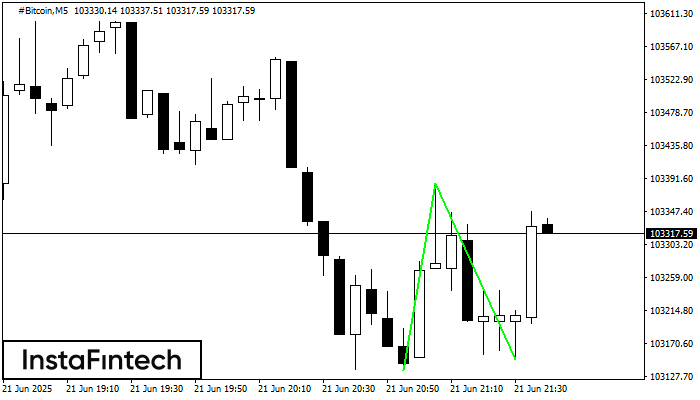
El patrón Doble Piso ha sido formado en #Bitcoin M5; el límite superior es 103384.03; el límite inferior es 103150.22. El ancho del patrón es 24856 puntos. En caso
Los marcos de tiempo M5 y M15 pueden tener más puntos de entrada falsos.
Open chart in a new window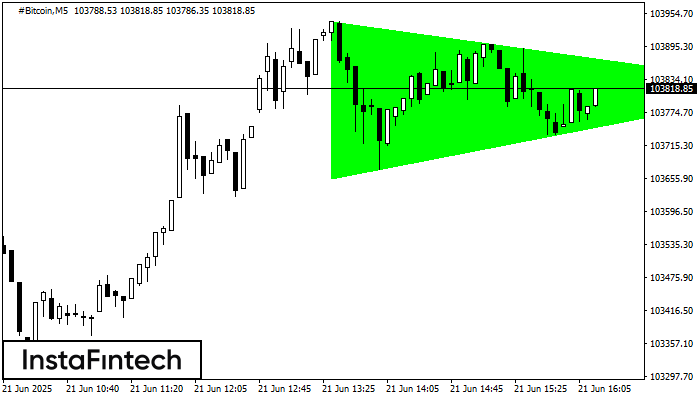
Según el gráfico de M5, el #Bitcoin formó el patrón Triángulo Simétrico Alcista. El límite inferior del patrón toca las coordenadas 103655.19/103820.77 donde el límite superior cruza 103940.04/103820.77
Los marcos de tiempo M5 y M15 pueden tener más puntos de entrada falsos.
Open chart in a new window
El patrón Triple Piso ha sido formado en GOLD M5. Este tiene las siguientes características: nivel de resistencia 3372.86/3370.25; nivel de soporte 3364.73/3364.26; el ancho es 813 puntos. En caso
Los marcos de tiempo M5 y M15 pueden tener más puntos de entrada falsos.
Open chart in a new window


