


signal strength 1 of 5
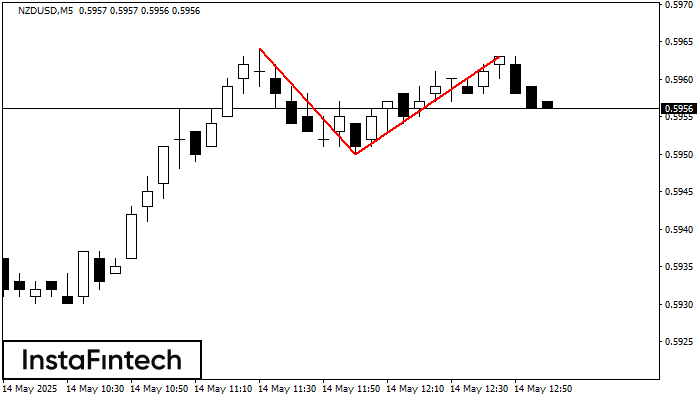
On the chart of NZDUSD M5 the Double Top reversal pattern has been formed. Characteristics: the upper boundary 0.5963; the lower boundary 0.5950; the width of the pattern 13 points. The signal: a break of the lower boundary will cause continuation of the downward trend targeting the 0.5935 level.
The M5 and M15 time frames may have more false entry points.
See Also
- All
- Double Top
- Flag
- Head and Shoulders
- Pennant
- Rectangle
- Triangle
- Triple top
- All
- #AAPL
- #AMZN
- #Bitcoin
- #EBAY
- #FB
- #GOOG
- #INTC
- #KO
- #MA
- #MCD
- #MSFT
- #NTDOY
- #PEP
- #TSLA
- #TWTR
- AUDCAD
- AUDCHF
- AUDJPY
- AUDUSD
- EURCAD
- EURCHF
- EURGBP
- EURJPY
- EURNZD
- EURRUB
- EURUSD
- GBPAUD
- GBPCHF
- GBPJPY
- GBPUSD
- GOLD
- NZDCAD
- NZDCHF
- NZDJPY
- NZDUSD
- SILVER
- USDCAD
- USDCHF
- USDJPY
- USDRUB
- All
- M5
- M15
- M30
- H1
- D1
- All
- Buy
- Sale
- All
- 1
- 2
- 3
- 4
- 5
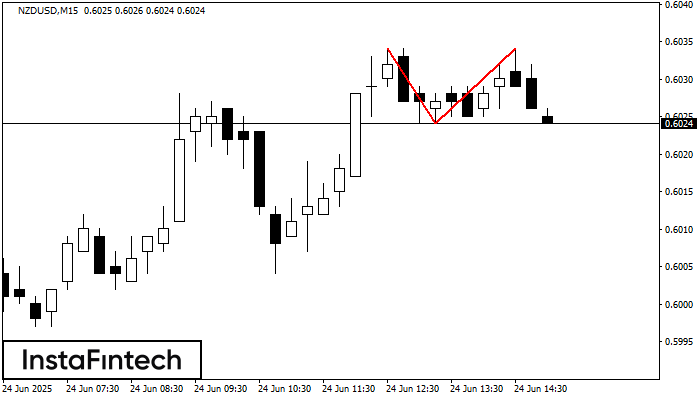
The Double Top reversal pattern has been formed on NZDUSD M15. Characteristics: the upper boundary 0.6034; the lower boundary 0.6024; the width of the pattern is 10 points. Sell trades
The M5 and M15 time frames may have more false entry points.
Open chart in a new window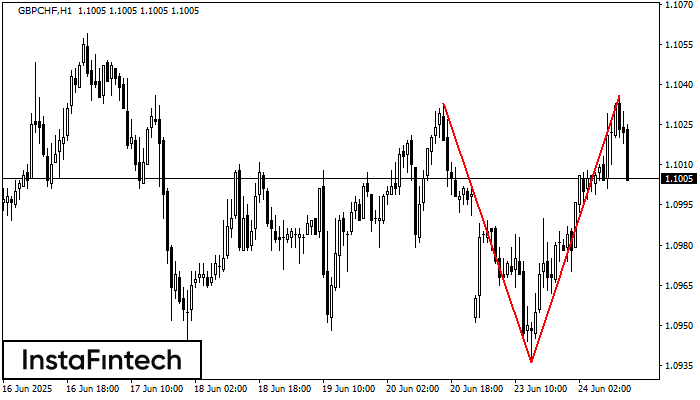
The Double Top pattern has been formed on GBPCHF H1. It signals that the trend has been changed from upwards to downwards. Probably, if the base of the pattern 1.0936
Open chart in a new window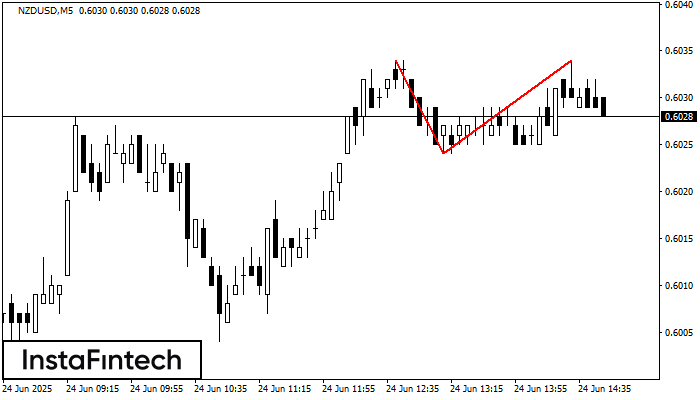
The Double Top reversal pattern has been formed on NZDUSD M5. Characteristics: the upper boundary 0.6034; the lower boundary 0.6024; the width of the pattern is 10 points. Sell trades
The M5 and M15 time frames may have more false entry points.
Open chart in a new window


