


signal strength 1 of 5
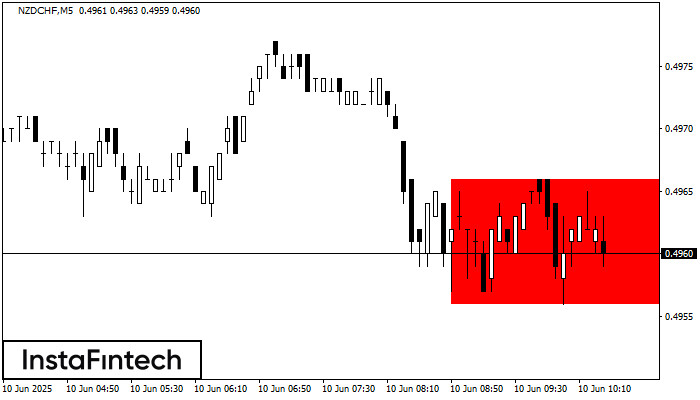
According to the chart of M5, NZDCHF formed the Bearish Rectangle. The pattern indicates a trend continuation. The upper border is 0.4966, the lower border is 0.4956. The signal means that a short position should be opened after fixing a price below the lower border 0.4956 of the Bearish Rectangle.
The M5 and M15 time frames may have more false entry points.
See Also
- All
- Double Top
- Flag
- Head and Shoulders
- Pennant
- Rectangle
- Triangle
- Triple top
- All
- #AAPL
- #AMZN
- #Bitcoin
- #EBAY
- #FB
- #GOOG
- #INTC
- #KO
- #MA
- #MCD
- #MSFT
- #NTDOY
- #PEP
- #TSLA
- #TWTR
- AUDCAD
- AUDCHF
- AUDJPY
- AUDUSD
- EURCAD
- EURCHF
- EURGBP
- EURJPY
- EURNZD
- EURRUB
- EURUSD
- GBPAUD
- GBPCHF
- GBPJPY
- GBPUSD
- GOLD
- NZDCAD
- NZDCHF
- NZDJPY
- NZDUSD
- SILVER
- USDCAD
- USDCHF
- USDJPY
- USDRUB
- All
- M5
- M15
- M30
- H1
- D1
- All
- Buy
- Sale
- All
- 1
- 2
- 3
- 4
- 5
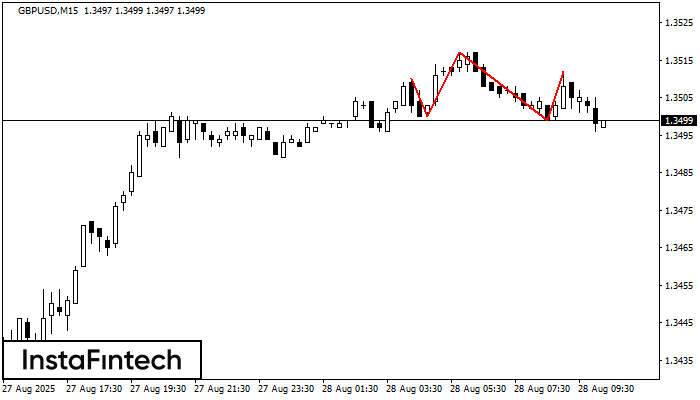
The GBPUSD M15 formed the Head and Shoulders pattern with the following features: The Head’s top is at 1.3517, the Neckline and the upward angle are at 1.3500/1.3499. The formation
The M5 and M15 time frames may have more false entry points.
Open chart in a new window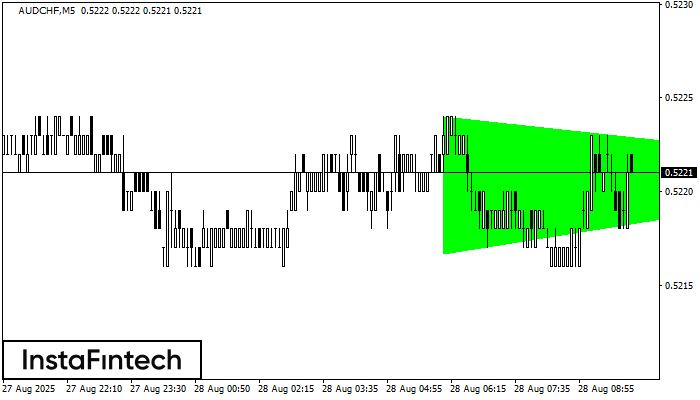
According to the chart of M5, AUDCHF formed the Bullish Symmetrical Triangle pattern, which signals the trend will continue. Description. The upper border of the pattern touches the coordinates 0.5224/0.5221
The M5 and M15 time frames may have more false entry points.
Open chart in a new window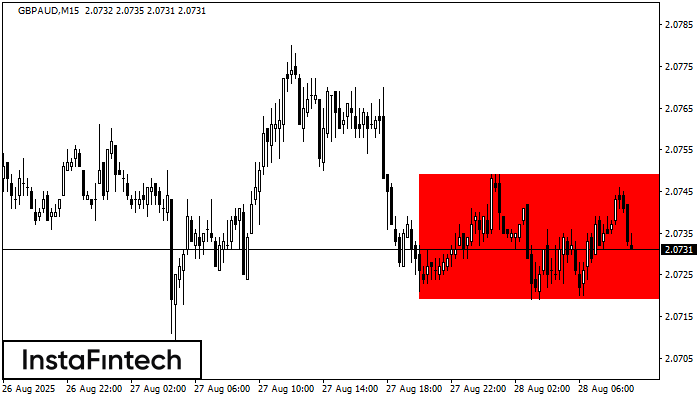
According to the chart of M15, GBPAUD formed the Bearish Rectangle. This type of a pattern indicates a trend continuation. It consists of two levels: resistance 2.0749 - 0.0000
The M5 and M15 time frames may have more false entry points.
Open chart in a new window


