


signal strength 4 of 5
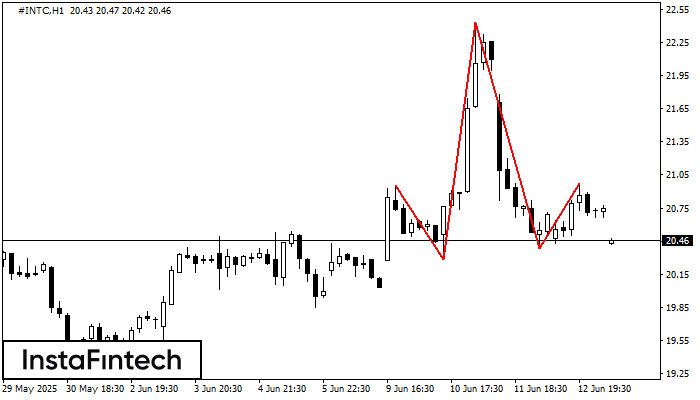
The #INTC H1 formed the Head and Shoulders pattern with the following features: The Head’s top is at 22.43, the Neckline and the upward angle are at 20.28/20.38. The formation of this pattern can bring about changes in the current trend from bullish to bearish. In case the pattern triggers the expected changes, the price of #INTC will go towards 19.98.
See Also
- All
- Double Top
- Flag
- Head and Shoulders
- Pennant
- Rectangle
- Triangle
- Triple top
- All
- #AAPL
- #AMZN
- #Bitcoin
- #EBAY
- #FB
- #GOOG
- #INTC
- #KO
- #MA
- #MCD
- #MSFT
- #NTDOY
- #PEP
- #TSLA
- #TWTR
- AUDCAD
- AUDCHF
- AUDJPY
- AUDUSD
- EURCAD
- EURCHF
- EURGBP
- EURJPY
- EURNZD
- EURRUB
- EURUSD
- GBPAUD
- GBPCHF
- GBPJPY
- GBPUSD
- GOLD
- NZDCAD
- NZDCHF
- NZDJPY
- NZDUSD
- SILVER
- USDCAD
- USDCHF
- USDJPY
- USDRUB
- All
- M5
- M15
- M30
- H1
- D1
- All
- Buy
- Sale
- All
- 1
- 2
- 3
- 4
- 5
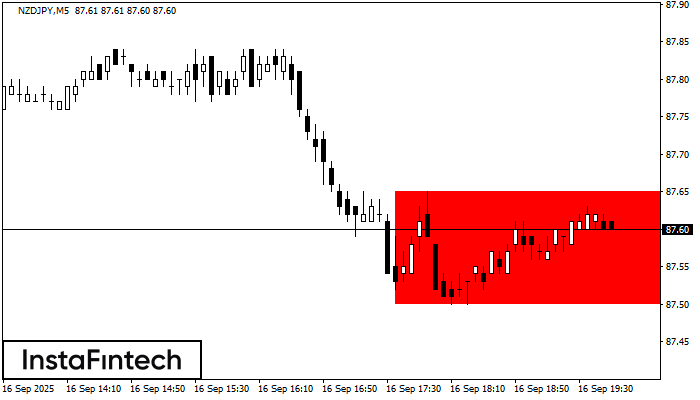
According to the chart of M5, NZDJPY formed the Bearish Rectangle. This type of a pattern indicates a trend continuation. It consists of two levels: resistance 87.65 - 0.00
The M5 and M15 time frames may have more false entry points.
Open chart in a new window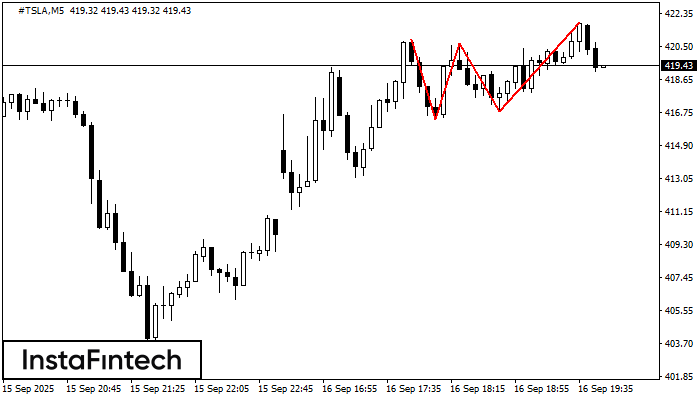
The Triple Top pattern has formed on the chart of the #TSLA M5 trading instrument. It is a reversal pattern featuring the following characteristics: resistance level -97, support level -48
The M5 and M15 time frames may have more false entry points.
Open chart in a new window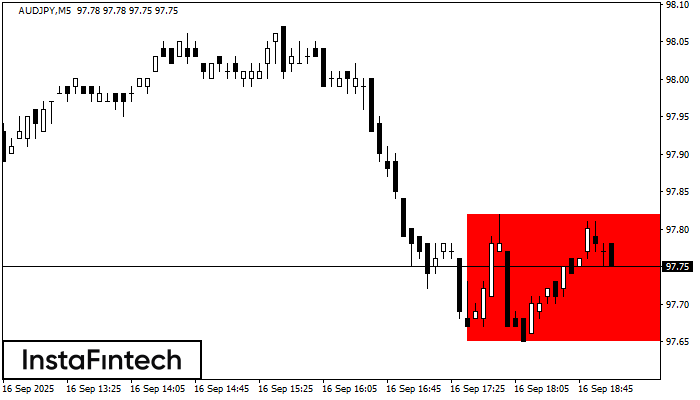
According to the chart of M5, AUDJPY formed the Bearish Rectangle which is a pattern of a trend continuation. The pattern is contained within the following borders: lower border 97.65
The M5 and M15 time frames may have more false entry points.
Open chart in a new window


