


signal strength 1 of 5
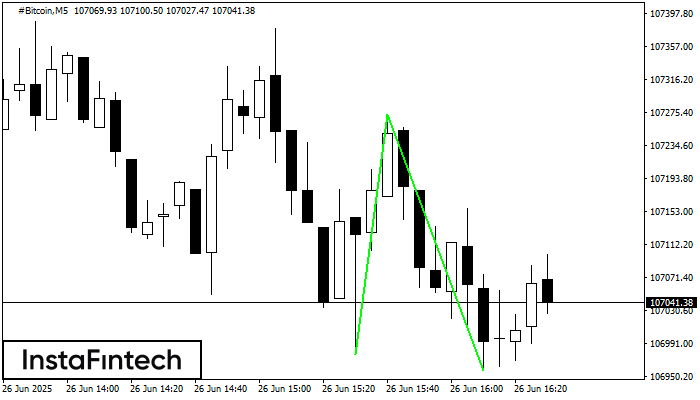
The Double Bottom pattern has been formed on #Bitcoin M5. Characteristics: the support level 106976.78; the resistance level 107273.49; the width of the pattern 29671 points. If the resistance level is broken, a change in the trend can be predicted with the first target point lying at the distance of 31607 points.
The M5 and M15 time frames may have more false entry points.
See Also
- All
- Double Top
- Flag
- Head and Shoulders
- Pennant
- Rectangle
- Triangle
- Triple top
- All
- #AAPL
- #AMZN
- #Bitcoin
- #EBAY
- #FB
- #GOOG
- #INTC
- #KO
- #MA
- #MCD
- #MSFT
- #NTDOY
- #PEP
- #TSLA
- #TWTR
- AUDCAD
- AUDCHF
- AUDJPY
- AUDUSD
- EURCAD
- EURCHF
- EURGBP
- EURJPY
- EURNZD
- EURRUB
- EURUSD
- GBPAUD
- GBPCHF
- GBPJPY
- GBPUSD
- GOLD
- NZDCAD
- NZDCHF
- NZDJPY
- NZDUSD
- SILVER
- USDCAD
- USDCHF
- USDJPY
- USDRUB
- All
- M5
- M15
- M30
- H1
- D1
- All
- Buy
- Sale
- All
- 1
- 2
- 3
- 4
- 5
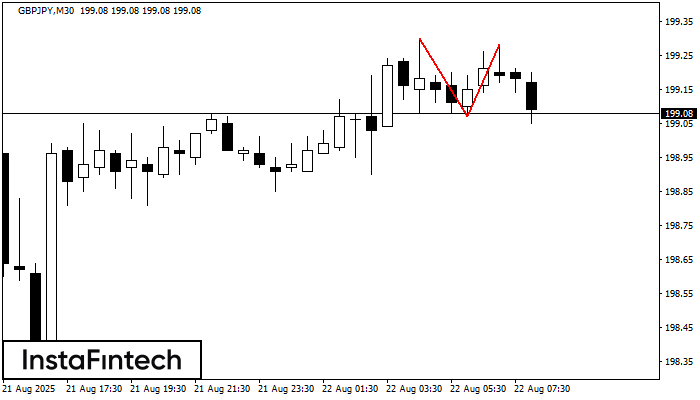
The Double Top reversal pattern has been formed on GBPJPY M30. Characteristics: the upper boundary 199.30; the lower boundary 199.07; the width of the pattern is 21 points. Sell trades
Open chart in a new window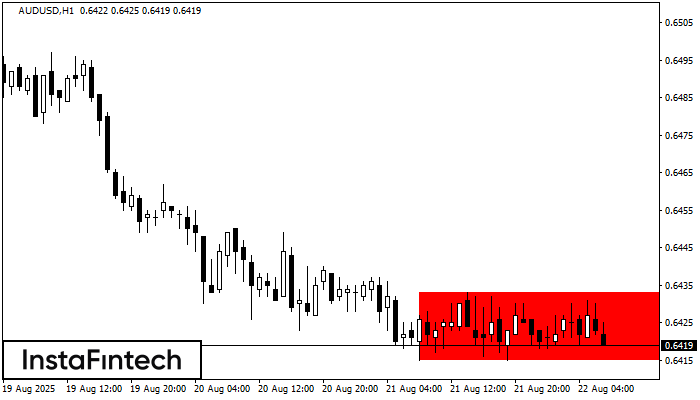
According to the chart of H1, AUDUSD formed the Bearish Rectangle. The pattern indicates a trend continuation. The upper border is 0.6433, the lower border is 0.6415. The signal means
Open chart in a new window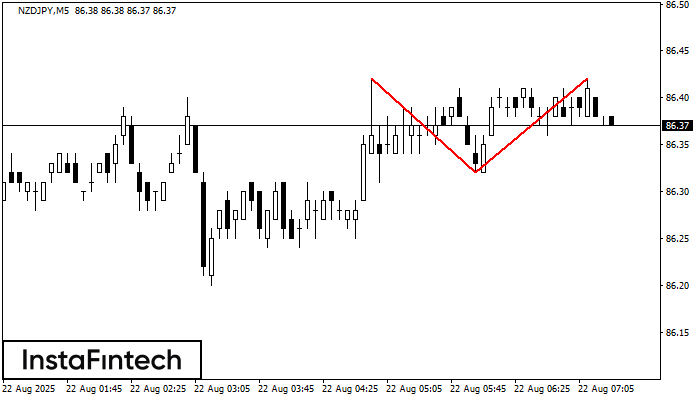
The Double Top reversal pattern has been formed on NZDJPY M5. Characteristics: the upper boundary 86.42; the lower boundary 86.32; the width of the pattern is 10 points. Sell trades
The M5 and M15 time frames may have more false entry points.
Open chart in a new window


