


signal strength 4 of 5
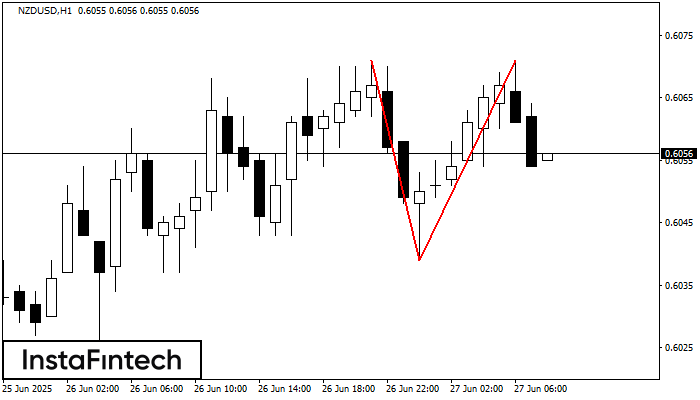
The Double Top pattern has been formed on NZDUSD H1. It signals that the trend has been changed from upwards to downwards. Probably, if the base of the pattern 0.6039 is broken, the downward movement will continue.
See Also
- All
- Double Top
- Flag
- Head and Shoulders
- Pennant
- Rectangle
- Triangle
- Triple top
- All
- #AAPL
- #AMZN
- #Bitcoin
- #EBAY
- #FB
- #GOOG
- #INTC
- #KO
- #MA
- #MCD
- #MSFT
- #NTDOY
- #PEP
- #TSLA
- #TWTR
- AUDCAD
- AUDCHF
- AUDJPY
- AUDUSD
- EURCAD
- EURCHF
- EURGBP
- EURJPY
- EURNZD
- EURRUB
- EURUSD
- GBPAUD
- GBPCHF
- GBPJPY
- GBPUSD
- GOLD
- NZDCAD
- NZDCHF
- NZDJPY
- NZDUSD
- SILVER
- USDCAD
- USDCHF
- USDJPY
- USDRUB
- All
- M5
- M15
- M30
- H1
- D1
- All
- Buy
- Sale
- All
- 1
- 2
- 3
- 4
- 5
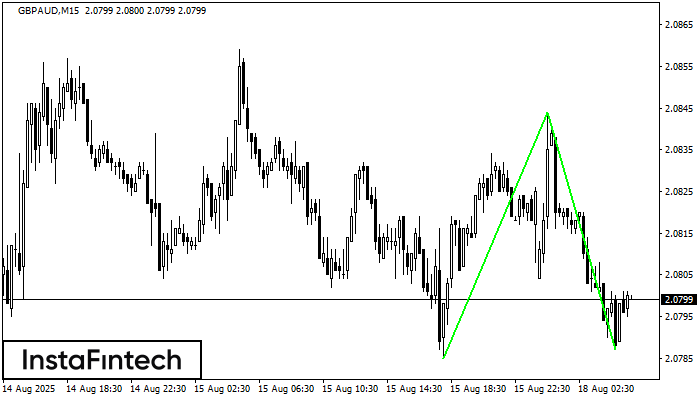
The Double Bottom pattern has been formed on GBPAUD M15. Characteristics: the support level 2.0785; the resistance level 2.0844; the width of the pattern 59 points. If the resistance level
The M5 and M15 time frames may have more false entry points.
Open chart in a new window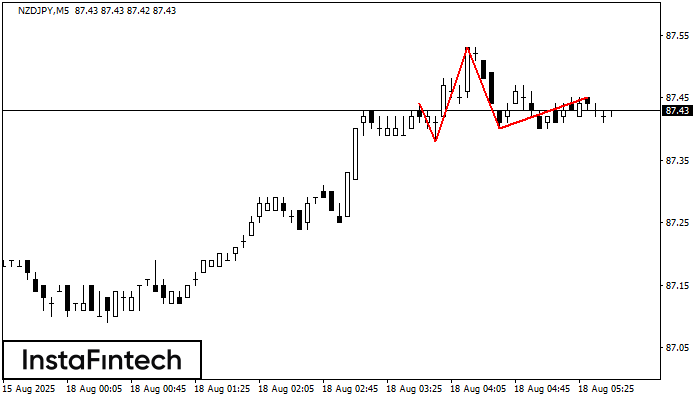
The technical pattern called Head and Shoulders has appeared on the chart of NZDJPY M5. There are weighty reasons to suggest that the price will surpass the Neckline 87.38/87.40 after
The M5 and M15 time frames may have more false entry points.
Open chart in a new window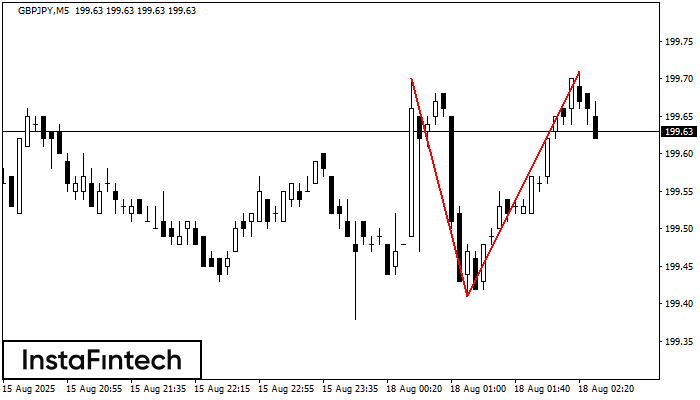
The Double Top reversal pattern has been formed on GBPJPY M5. Characteristics: the upper boundary 199.70; the lower boundary 199.41; the width of the pattern is 30 points. Sell trades
The M5 and M15 time frames may have more false entry points.
Open chart in a new window


