


signal strength 1 of 5
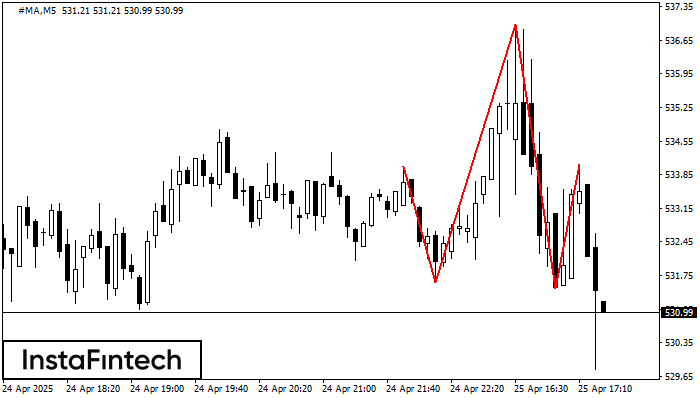
The technical pattern called Head and Shoulders has appeared on the chart of #MA M5. There are weighty reasons to suggest that the price will surpass the Neckline 531.61/531.48 after the right shoulder has been formed. So, the trend is set to change with the price heading for 531.33.
The M5 and M15 time frames may have more false entry points.
See Also
- All
- Double Top
- Flag
- Head and Shoulders
- Pennant
- Rectangle
- Triangle
- Triple top
- All
- #AAPL
- #AMZN
- #Bitcoin
- #EBAY
- #FB
- #GOOG
- #INTC
- #KO
- #MA
- #MCD
- #MSFT
- #NTDOY
- #PEP
- #TSLA
- #TWTR
- AUDCAD
- AUDCHF
- AUDJPY
- AUDUSD
- EURCAD
- EURCHF
- EURGBP
- EURJPY
- EURNZD
- EURRUB
- EURUSD
- GBPAUD
- GBPCHF
- GBPJPY
- GBPUSD
- GOLD
- NZDCAD
- NZDCHF
- NZDJPY
- NZDUSD
- SILVER
- USDCAD
- USDCHF
- USDJPY
- USDRUB
- All
- M5
- M15
- M30
- H1
- D1
- All
- Buy
- Sale
- All
- 1
- 2
- 3
- 4
- 5
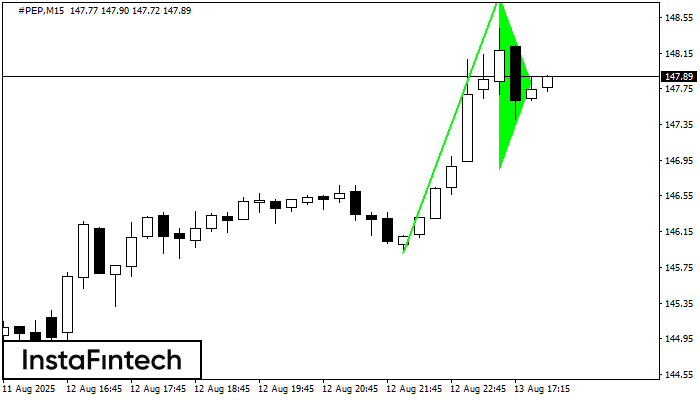
La señal Banderín alcista – Instrumento de negociación #PEP M15, patrón de continuación. Pronóstico: es posible establecer una posición de compra por encima del alza del patrón de 148.79
Los marcos de tiempo M5 y M15 pueden tener más puntos de entrada falsos.
Open chart in a new window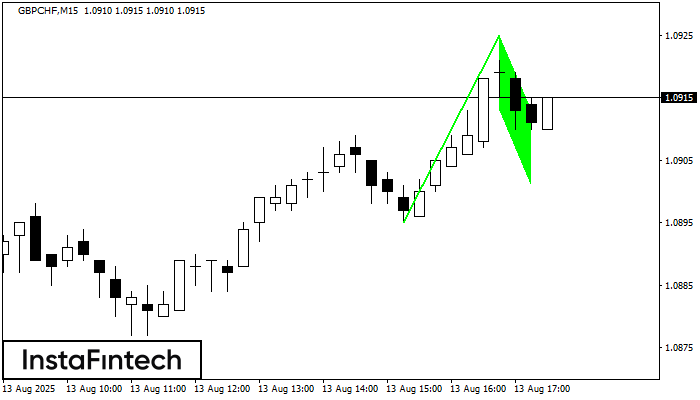
El patrón Bandera alcista que señala la continuación de una tendencia ha sido formado en el gráfico GBPCHF M15. Pronóstico: si el precio rompe por encima del alza del patrón
Los marcos de tiempo M5 y M15 pueden tener más puntos de entrada falsos.
Open chart in a new window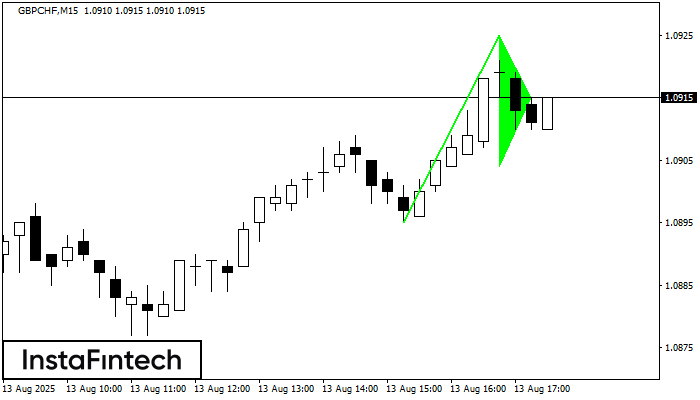
El patrón Banderín alcista está formado en el gráfico GBPCHF M15. Este es un tipo de patrón de continuación. Supuestamente, en caso de que el precio se fije por encima
Los marcos de tiempo M5 y M15 pueden tener más puntos de entrada falsos.
Open chart in a new window


