


signal strength 4 of 5
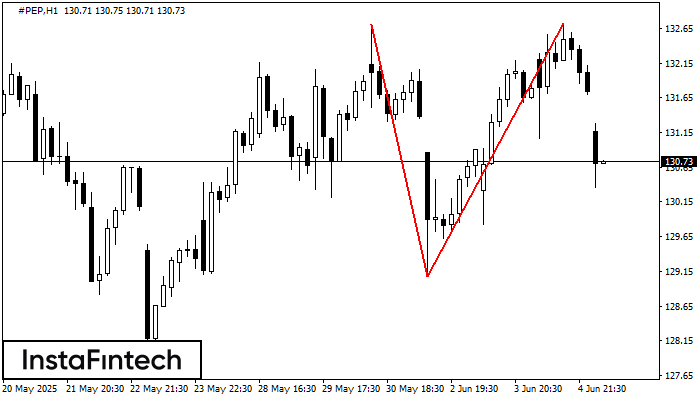
On the chart of #PEP H1 the Double Top reversal pattern has been formed. Characteristics: the upper boundary 132.72; the lower boundary 129.07; the width of the pattern 365 points. The signal: a break of the lower boundary will cause continuation of the downward trend targeting the 128.67 level.
- All
- Double Top
- Flag
- Head and Shoulders
- Pennant
- Rectangle
- Triangle
- Triple top
- All
- #AAPL
- #AMZN
- #Bitcoin
- #EBAY
- #FB
- #GOOG
- #INTC
- #KO
- #MA
- #MCD
- #MSFT
- #NTDOY
- #PEP
- #TSLA
- #TWTR
- AUDCAD
- AUDCHF
- AUDJPY
- AUDUSD
- EURCAD
- EURCHF
- EURGBP
- EURJPY
- EURNZD
- EURRUB
- EURUSD
- GBPAUD
- GBPCHF
- GBPJPY
- GBPUSD
- GOLD
- NZDCAD
- NZDCHF
- NZDJPY
- NZDUSD
- SILVER
- USDCAD
- USDCHF
- USDJPY
- USDRUB
- All
- M5
- M15
- M30
- H1
- D1
- All
- Buy
- Sale
- All
- 1
- 2
- 3
- 4
- 5
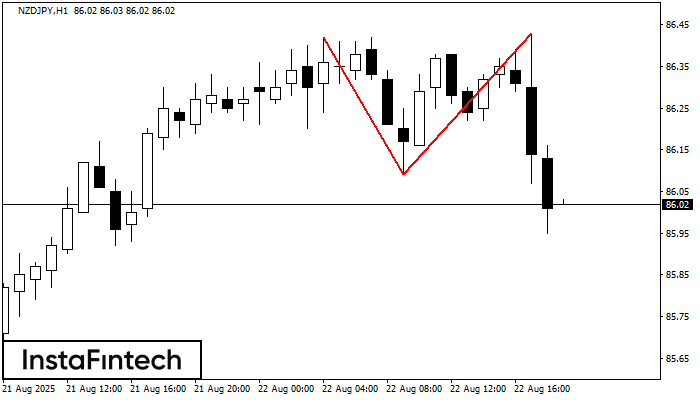
The Double Top reversal pattern has been formed on NZDJPY H1. Characteristics: the upper boundary 86.42; the lower boundary 86.09; the width of the pattern is 34 points. Sell trades
Open chart in a new window
The Double Top pattern has been formed on NZDCAD M5. It signals that the trend has been changed from upwards to downwards. Probably, if the base of the pattern 0.8112
The M5 and M15 time frames may have more false entry points.
Open chart in a new window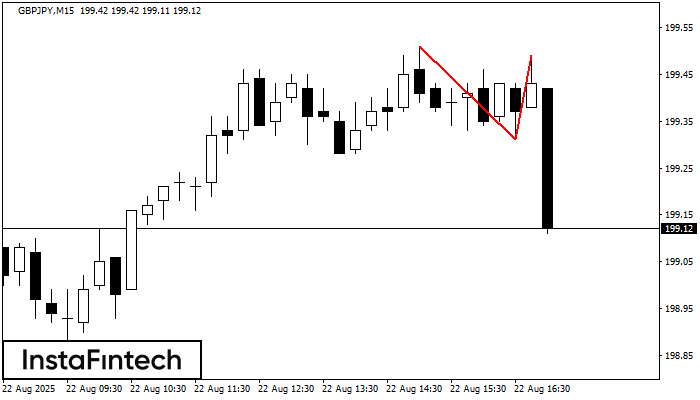
On the chart of GBPJPY M15 the Double Top reversal pattern has been formed. Characteristics: the upper boundary 199.49; the lower boundary 199.31; the width of the pattern 18 points
The M5 and M15 time frames may have more false entry points.
Open chart in a new window


