

signal strength 1 of 5
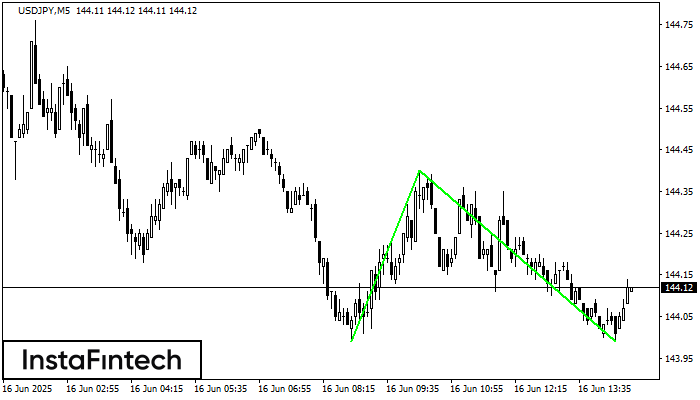
The Double Bottom pattern has been formed on USDJPY M5. Characteristics: the support level 143.99; the resistance level 144.40; the width of the pattern 41 points. If the resistance level is broken, a change in the trend can be predicted with the first target point lying at the distance of 41 points.
The M5 and M15 time frames may have more false entry points.
See Also
- All
- Double Top
- Flag
- Head and Shoulders
- Pennant
- Rectangle
- Triangle
- Triple top
- All
- #AAPL
- #AMZN
- #Bitcoin
- #EBAY
- #FB
- #GOOG
- #INTC
- #KO
- #MA
- #MCD
- #MSFT
- #NTDOY
- #PEP
- #TSLA
- #TWTR
- AUDCAD
- AUDCHF
- AUDJPY
- AUDUSD
- EURCAD
- EURCHF
- EURGBP
- EURJPY
- EURNZD
- EURRUB
- EURUSD
- GBPAUD
- GBPCHF
- GBPJPY
- GBPUSD
- GOLD
- NZDCAD
- NZDCHF
- NZDJPY
- NZDUSD
- SILVER
- USDCAD
- USDCHF
- USDJPY
- USDRUB
- All
- M5
- M15
- M30
- H1
- D1
- All
- Buy
- Sale
- All
- 1
- 2
- 3
- 4
- 5
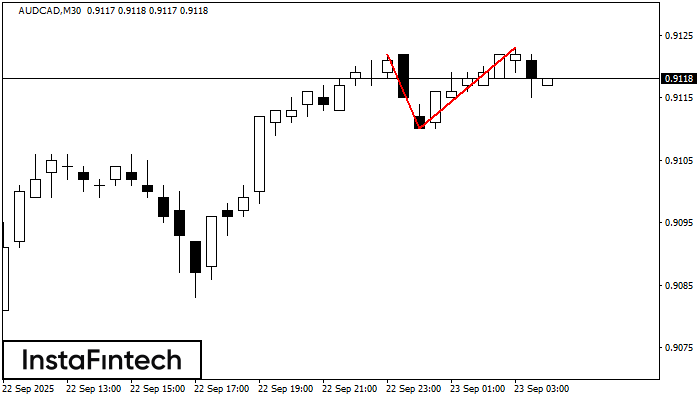
On the chart of AUDCAD M30 the Double Top reversal pattern has been formed. Characteristics: the upper boundary 0.9123; the lower boundary 0.9110; the width of the pattern 13 points
Open chart in a new window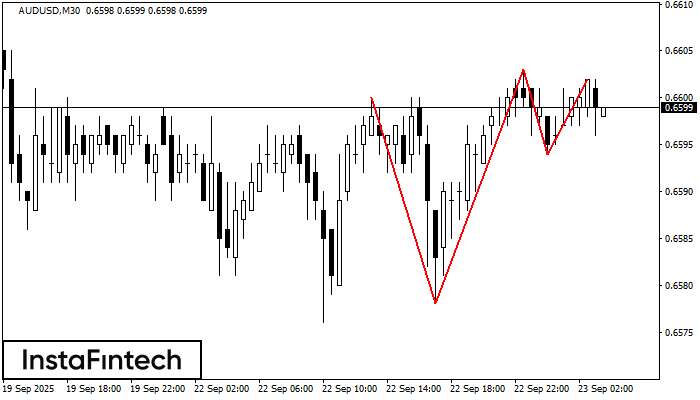
On the chart of the AUDUSD M30 trading instrument, the Triple Top pattern that signals a trend change has formed. It is possible that after formation of the third peak
Open chart in a new window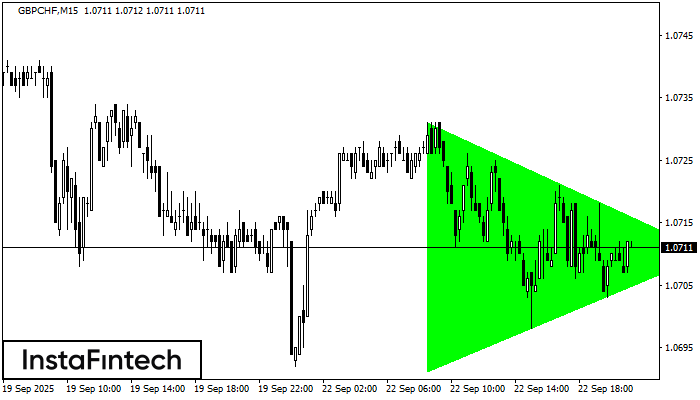
According to the chart of M15, GBPCHF formed the Bullish Symmetrical Triangle pattern. Description: This is the pattern of a trend continuation. 1.0731 and 1.0691 are the coordinates
The M5 and M15 time frames may have more false entry points.
Open chart in a new window


