Bitcoin Bulls Eye Resistance: Breakout on the Horizon?
Spotlight on Bitcoin's Market Dynamics as Bulls Gather Strength
Key Takeaways:
- Facebook and Instagram's Advertising Shift: Facebook and Instagram now permit advertising for Bitcoin ETFs, significantly broadening cryptocurrency exposure and potentially increasing adoption among older demographics less engaged with digital assets.
- Bullish Market Indicators for Bitcoin: The BTC/USD pair is demonstrating bullish momentum, trading near crucial resistance at $43,865. With a strong bounce from the 100 MA and positive market sentiment, there's potential for an upward breakout.
- Pivotal Week for Bitcoin Traders: The sentiment remains strongly bullish, with 66% favoring bulls. Key support at $42,217 and resistance at $43,865 are pivotal for traders, with the upcoming week likely to be decisive for Bitcoin's short-term trend.

Cryptocurrency Industry Shifts: The advertising landscape for cryptocurrencies is evolving. Facebook and Instagram's decision to allow advertisements for Bitcoin ETFs marks a significant change. This opens doors for increased cryptocurrency adoption and reaches a broader investor base, including those unfamiliar with digital assets.
Impact of Social Media Advertising: Facebook and Instagram's vast user base, exceeding 2 billion monthly active users, offers unprecedented exposure for Bitcoin ETFs. Targeted advertising can now tap into demographics previously less engaged with cryptocurrencies, notably older investors.
Google's Role in Cryptocurrency Promotion: Google's recent policy changes also favor cryptocurrency products, including Bitcoin ETFs. This broader acceptance in major online platforms signals a growing mainstream interest in digital assets.
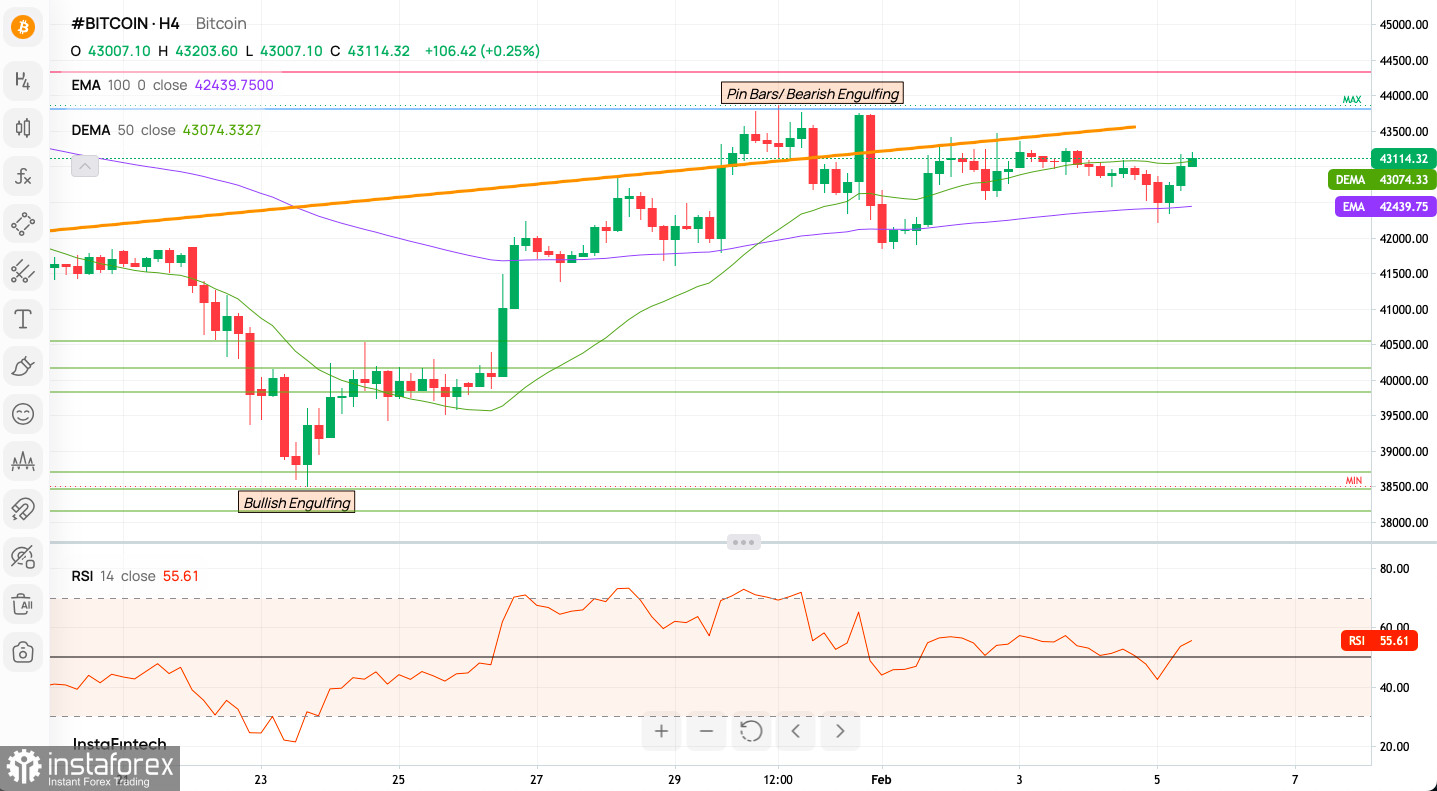
Bitcoin's Technical Market Outlook: Bitcoin, trading near $43,865, shows bulls regaining market control. A notable bounce from the 100 MA on the H4 chart and rising momentum indicate a bullish sentiment. Key support levels are identified at $42,217 and $41,848. For further gains, bulls must overcome the short-term trend line resistance.
Day Trading Analysis for Bitcoin:
Moving Averages: Bitcoin fluctuates between the 50-period DEMA and 100-period EMA, suggesting a consolidation phase. The DEMA indicates shorter-term trends, while the EMA guides longer-term directions.
RSI (Relative Strength Index): Currently above 50, the RSI points to bullish momentum but remains clear of the overbought zone, indicating potential for further upward movement.
Price Action: Early bullish engulfing patterns showed strong buying pressure. However, recent pin bars and a bearish engulfing pattern hint at selling pressure at higher levels.
Scenarios for Day Traders:
Bullish: A sustained move above the 50-period DEMA could signify continued bullish momentum, possibly reaching the next resistance or recent highs. An RSI rise above 50, pushing towards 70, would confirm increasing buying pressure.
Bearish: Rejection at the 50-period DEMA, followed by a downward trend, might signal a shift in momentum. If the RSI declines below 50, it could indicate weakening bullish sentiment, opening short trade opportunities.
Intraday 1H Indicator Signals:
- Majority of technical indicators (19 out of 23) favor a Buy.
- Moving averages predominantly indicate Buy (16 out of 18).
Sentiment Overview: The sentiment leans heavily bullish, with recent trends maintaining this outlook.
Weekly Pivot Points: Pivot points serve as crucial market markers for potential trend changes and support/resistance levels.
WR3 - $44,629WR2 - $43,693WR1 - $43,312Weekly Pivot - $42,765WS1 - $42,376WS2 - $41,823WS3 - $40,887
Useful Links
Important Notice
The begginers in forex trading need to be very careful when making decisions about entering the market. Before the release of important reports, it is best to stay out of the market to avoid being caught in sharp market fluctuations due to increased volatility. If you decide to trade during the news release, then always place stop orders to minimize losses.
Without placing stop orders, you can very quickly lose your entire deposit, especially if you do not use money management and trade large volumes. For successful trading, you need to have a clear trading plan and stay focues and disciplined. Spontaneous trading decision based on the current market situation is an inherently losing strategy for a scalper or daytrader.
#instaforex #analysis #sebastianseliga