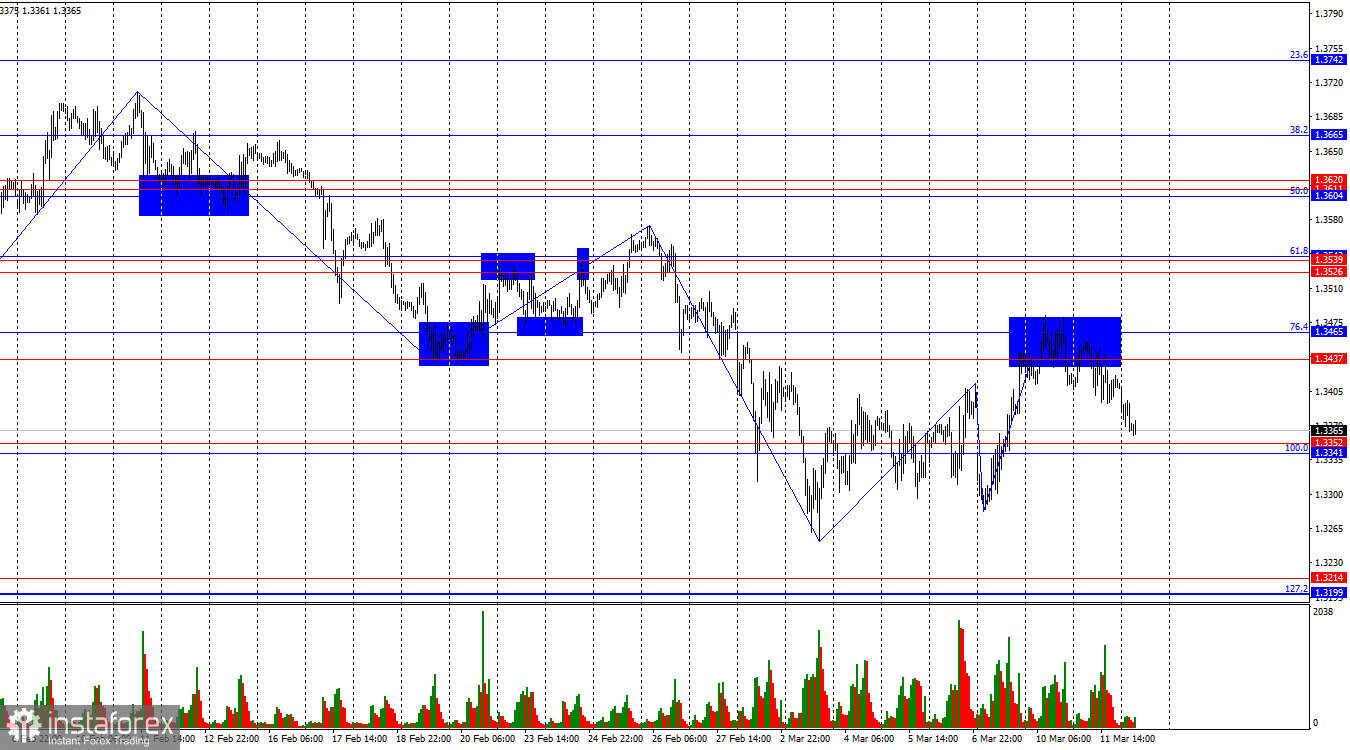
On the hourly chart, the GBP/USD pair on Wednesday rebounded from the resistance level of 1.3437–1.3465, reversed in favor of the U.S. dollar, and began a decline toward the 1.3341–1.3352 support level. A rebound from this zone would favor the British pound and a return to the 1.3437–1.3465 level. Consolidation below 1.3341–1.3352 would increase the likelihood of further decline toward the next support level at 1.3199–1.3214.
The wave structure continues to shift toward a bullish outlook. The latest completed downward wave did not break the previous low, while the latest upward wave broke the previous peak. Thus, we are beginning to see the first signs of a bullish trend emerging. The news background for the pound has been weak in recent months, while geopolitics has given bears a clear advantage in the market. The war in Iran could end soon, but there are currently no visible reasons for that. Bears once again feel supported.
The news background on Wednesday was rather dull and neutral. Traders may have paid attention to the U.S. inflation report. For February, the core Consumer Price Index remained unchanged at 2.5%, while headline inflation stayed at 2.4%. Thus, the report did not attract much attention from traders because the figures matched expectations. Throughout the day, bears continued their attacks, but for entirely different reasons.
Today, the key level for the pound is 1.3341–1.3352. If bears manage to break through it, the bearish trend on the hourly chart will most likely resume. For bears to retreat from the market, positive news from the Middle East would be required: a decline in oil and gas prices and the lifting of the blockade of the Strait of Hormuz. Unfortunately, such messages are not appearing in the news flow at the moment. Therefore, the bears' positions still look more stable than those of the bulls, who often have to attack based purely on enthusiasm.
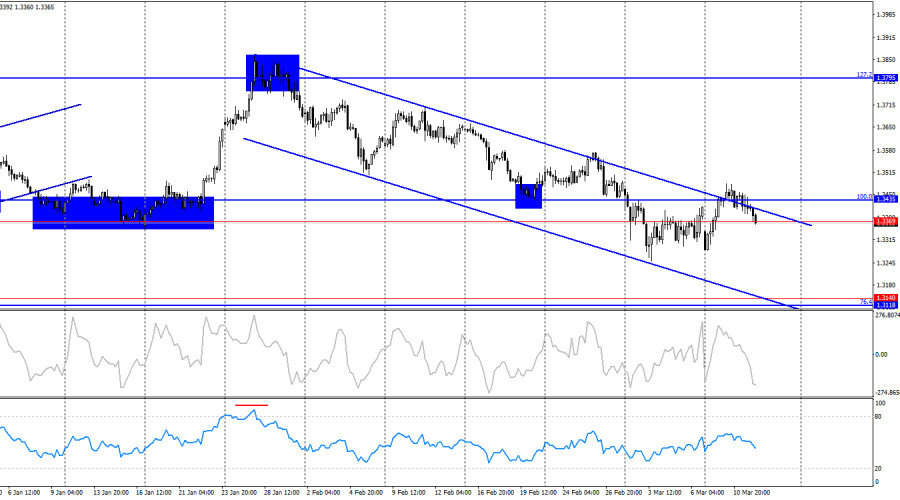
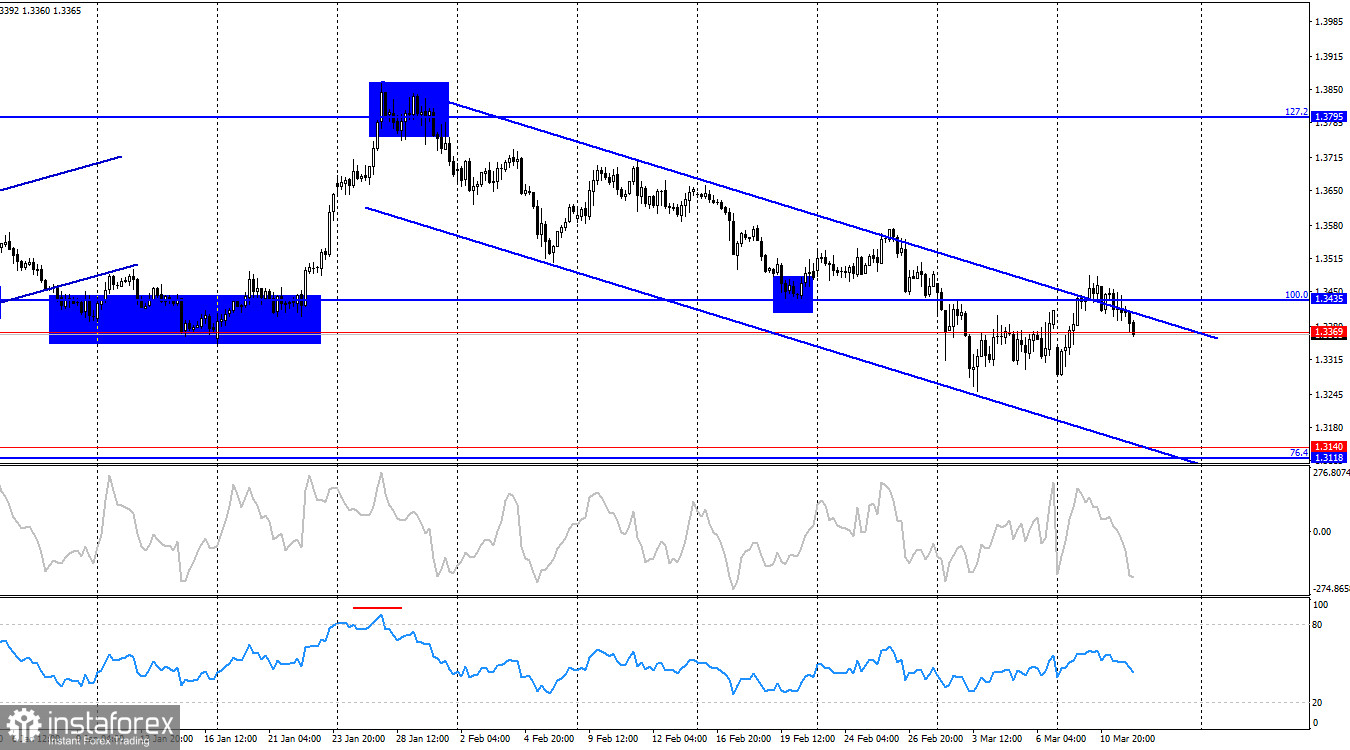
On the 4-hour chart, the pair has returned to the upper boundary of the descending trend channel. A rebound from this line and from the 1.3369–1.3435 level would favor the U.S. currency and a renewed decline toward the 1.3118–1.3140 support level. A close above the descending channel would suggest the end of the bearish trend and open the way for growth toward the 127.2% Fibonacci level at 1.3795. No emerging divergences are currently observed on any indicators.
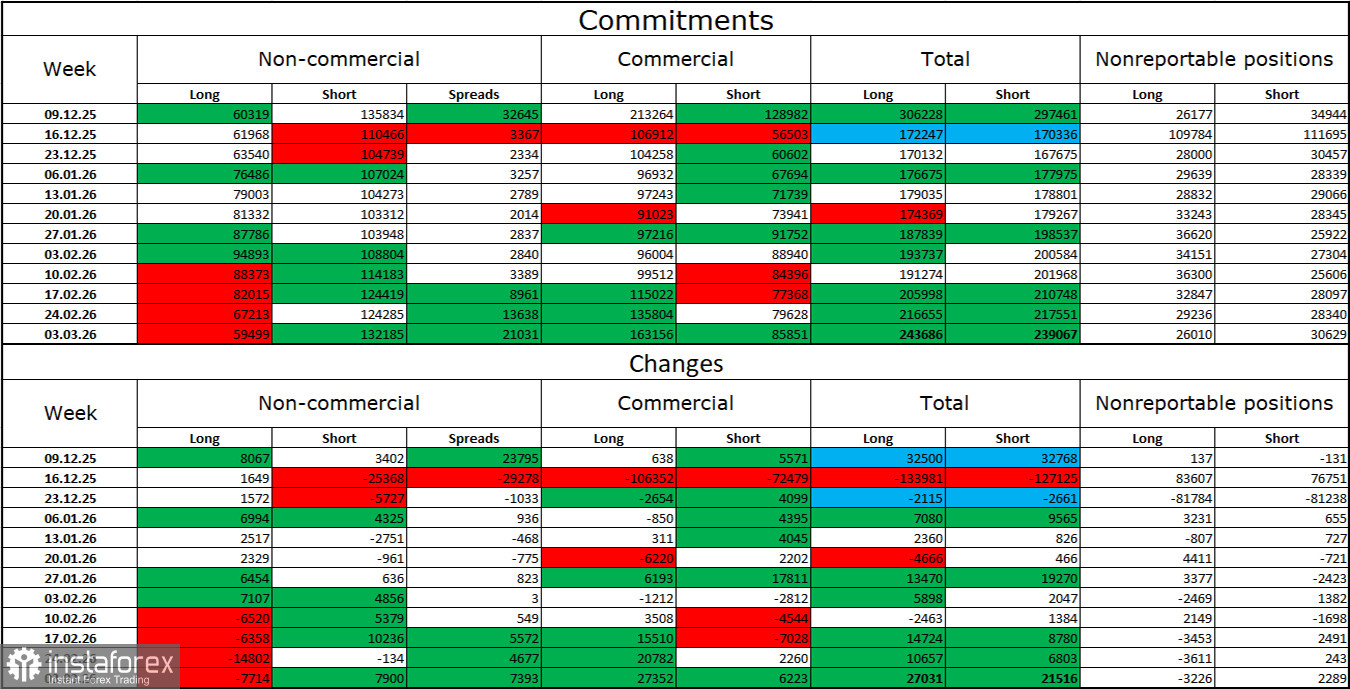
Commitments of Traders (COT) Report
The sentiment among non-commercial traders became more bearish during the latest reporting week, which no longer looks accidental under the current circumstances. The number of long positions held by speculators decreased by 7,714, while the number of short positions increased by 7,900. The gap between longs and shorts is now roughly 59,000 vs. 132,000.
In recent months, bears have dominated more often, although the situation with contracts on the euro currency is exactly the opposite. I still do not fully believe in a long-term bearish trend for the pound, but now everything will depend not on economic indicators or Trump's trade policy, but on the duration and scale of the war in the Middle East.
Over the past year, the pound looked like a safer currency compared to the dollar—more stable and with a clearer economic outlook. However, in recent months, first a correction began while the bullish trend was still intact, and then the conflict in the Middle East started escalating almost daily. Negotiations on an agreement between the United States and Iran failed, which is why the dollar is now strengthening due to geopolitics.
Economic Calendar (U.S. and U.K.)
United States:
- Building Permits (12:30 UTC)
- Housing Starts (12:30 UTC)
- Initial Jobless Claims (12:30 UTC)
On March 12, the economic calendar contains three relatively minor events. Therefore, the impact of the news background on market sentiment on Thursday may be extremely weak.
GBP/USD Forecast and Trading Tips
Selling the pair was possible after a rebound from the 1.3437–1.3465 level on the hourly chart with a target of 1.3341–1.3352. This target was almost reached. New selling opportunities may arise if the price closes below 1.3341–1.3352, targeting 1.3199–1.3214. Buying opportunities may appear today if the price rebounds from 1.3341–1.3352, targeting 1.3437–1.3465.
Fibonacci grids are built from 1.3341 to 1.3866 on the hourly chart and from 1.3431 to 1.2104 on the 4-hour chart.