signal strength 3 of 5

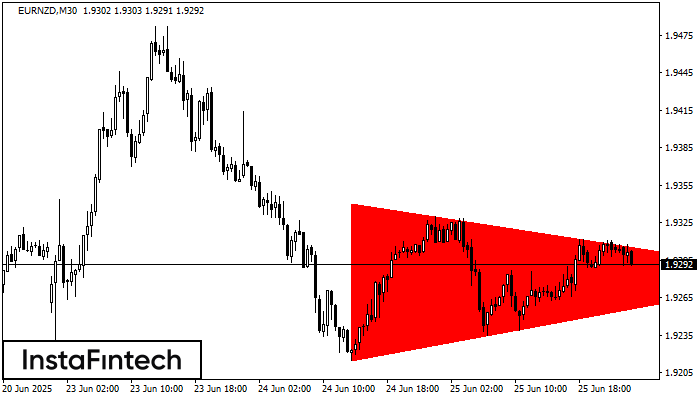
According to the chart of M30, EURNZD formed the Bearish Symmetrical Triangle pattern. Trading recommendations: A breach of the lower border 1.9215 is likely to encourage a continuation of the downward trend.
- All
- Double Top
- Flag
- Head and Shoulders
- Pennant
- Rectangle
- Triangle
- Triple top
- All
- #AAPL
- #AMZN
- #Bitcoin
- #EBAY
- #FB
- #GOOG
- #INTC
- #KO
- #MA
- #MCD
- #MSFT
- #NTDOY
- #PEP
- #TSLA
- #TWTR
- AUDCAD
- AUDCHF
- AUDJPY
- AUDUSD
- EURCAD
- EURCHF
- EURGBP
- EURJPY
- EURNZD
- EURRUB
- EURUSD
- GBPAUD
- GBPCHF
- GBPJPY
- GBPUSD
- GOLD
- NZDCAD
- NZDCHF
- NZDJPY
- NZDUSD
- SILVER
- USDCAD
- USDCHF
- USDJPY
- USDRUB
- All
- M5
- M15
- M30
- H1
- D1
- All
- Buy
- Sale
- All
- 1
- 2
- 3
- 4
- 5
The technical pattern called Head and Shoulders has appeared on the chart of AUDCHF M5. There are weighty reasons to suggest that the price will surpass the Neckline 0.5247/0.5249 after
The M5 and M15 time frames may have more false entry points.
Open chart in a new windowAccording to the chart of M5, GBPAUD formed the Inverse Head and Shoulder pattern. The Head’s top is set at 2.0516 while the median line of the Neck is found
The M5 and M15 time frames may have more false entry points.
Open chart in a new windowAccording to the chart of M5, GBPAUD produced the pattern termed the Inverse Head and Shoulder. The Head is fixed at 2.0493 while the median line of the Neck
The M5 and M15 time frames may have more false entry points.
Open chart in a new window