

signal strength 3 of 5
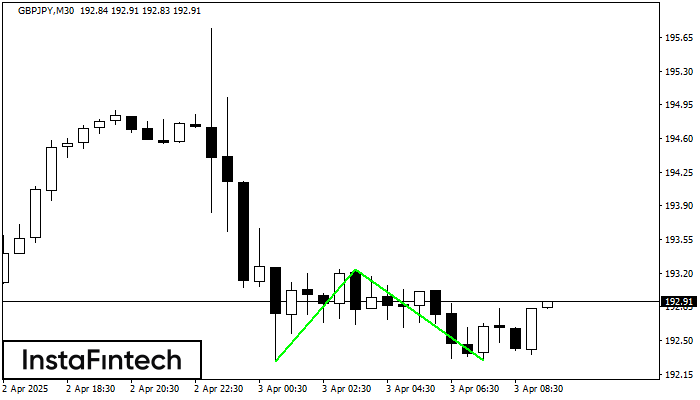
The Double Bottom pattern has been formed on GBPJPY M30; the upper boundary is 193.24; the lower boundary is 192.29. The width of the pattern is 96 points. In case of a break of the upper boundary 193.24, a change in the trend can be predicted where the width of the pattern will coincide with the distance to a possible take profit level.
See Also
- All
- Double Top
- Flag
- Head and Shoulders
- Pennant
- Rectangle
- Triangle
- Triple top
- All
- #AAPL
- #AMZN
- #Bitcoin
- #EBAY
- #FB
- #GOOG
- #INTC
- #KO
- #MA
- #MCD
- #MSFT
- #NTDOY
- #PEP
- #TSLA
- #TWTR
- AUDCAD
- AUDCHF
- AUDJPY
- AUDUSD
- EURCAD
- EURCHF
- EURGBP
- EURJPY
- EURNZD
- EURRUB
- EURUSD
- GBPAUD
- GBPCHF
- GBPJPY
- GBPUSD
- GOLD
- NZDCAD
- NZDCHF
- NZDJPY
- NZDUSD
- SILVER
- USDCAD
- USDCHF
- USDJPY
- USDRUB
- All
- M5
- M15
- M30
- H1
- D1
- All
- Buy
- Sale
- All
- 1
- 2
- 3
- 4
- 5
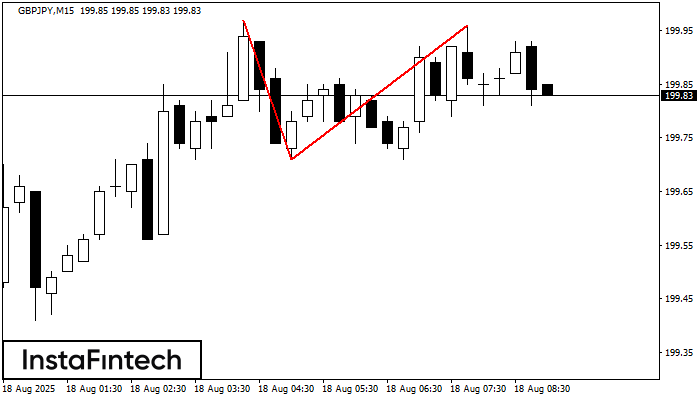
На торговом графике GBPJPY M15 сформировалась разворотная фигура «Двойная вершина». Характеристика: Верхняя граница 199.96; Нижняя граница 199.71; Ширина фигуры 25 пунктов. Сигнал: Пробой нижней границы 199.71 приведет к дальнейшему нисходящему
Таймфреймы М5 и М15 могут иметь больше ложных точек входа.
Открыть график инструмента в новом окне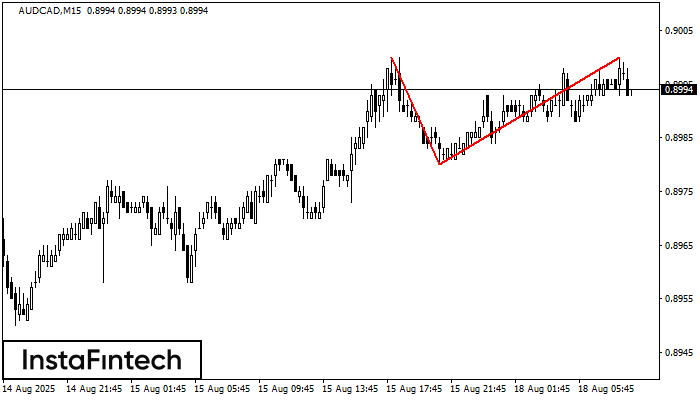
По AUDCAD на M15 сформировалась разворотная фигура «Двойная вершина». Характеристика: Верхняя граница 0.9000; Нижняя граница 0.8980; Ширина фигуры 20 пунктов. Позицию на продажу возможно открыть ниже нижней границы 0.8980
Таймфреймы М5 и М15 могут иметь больше ложных точек входа.
Открыть график инструмента в новом окне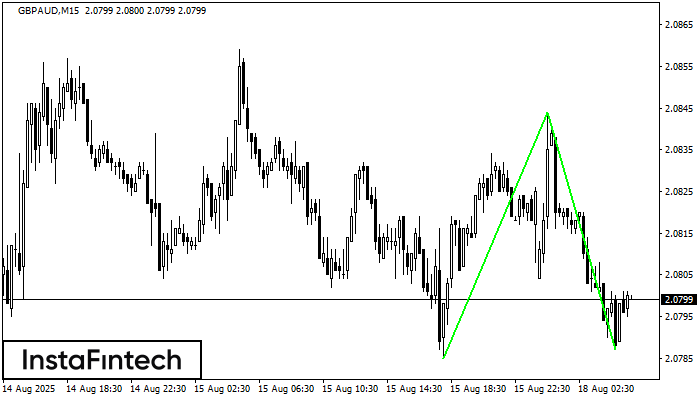
Сформирована фигура «Двойное дно» на графике GBPAUD M15. Характеристика: Уровень поддержки 2.0785; Уровень сопротивления 2.0844; Ширина фигуры 59 пунктов. В случае пробоя уровня сопротивления можно будет прогнозировать изменение тенденции
Таймфреймы М5 и М15 могут иметь больше ложных точек входа.
Открыть график инструмента в новом окне


