

signal strength 1 of 5
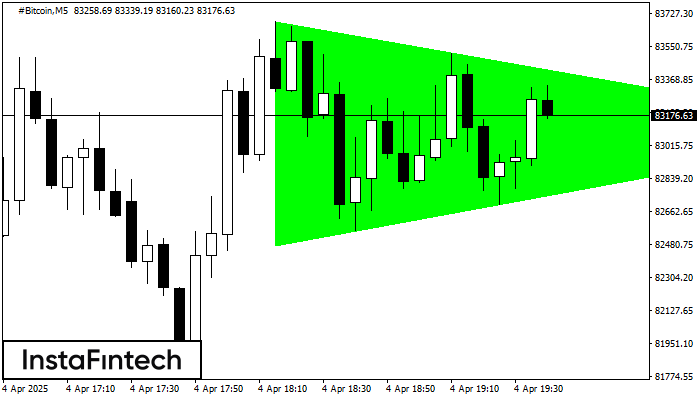
According to the chart of M5, #Bitcoin formed the Bullish Symmetrical Triangle pattern, which signals the trend will continue. Description. The upper border of the pattern touches the coordinates 83683.03/83088.93 whereas the lower border goes across 82478.14/83088.93. The pattern width is measured on the chart at 120489 pips. If the Bullish Symmetrical Triangle pattern is in progress during the upward trend, this indicates the current trend will go on. In case 83088.93 is broken, the price could continue its move toward 83089.08.
The M5 and M15 time frames may have more false entry points.
- All
- Double Top
- Flag
- Head and Shoulders
- Pennant
- Rectangle
- Triangle
- Triple top
- All
- #AAPL
- #AMZN
- #Bitcoin
- #EBAY
- #FB
- #GOOG
- #INTC
- #KO
- #MA
- #MCD
- #MSFT
- #NTDOY
- #PEP
- #TSLA
- #TWTR
- AUDCAD
- AUDCHF
- AUDJPY
- AUDUSD
- EURCAD
- EURCHF
- EURGBP
- EURJPY
- EURNZD
- EURRUB
- EURUSD
- GBPAUD
- GBPCHF
- GBPJPY
- GBPUSD
- GOLD
- NZDCAD
- NZDCHF
- NZDJPY
- NZDUSD
- SILVER
- USDCAD
- USDCHF
- USDJPY
- USDRUB
- All
- M5
- M15
- M30
- H1
- D1
- All
- Buy
- Sale
- All
- 1
- 2
- 3
- 4
- 5
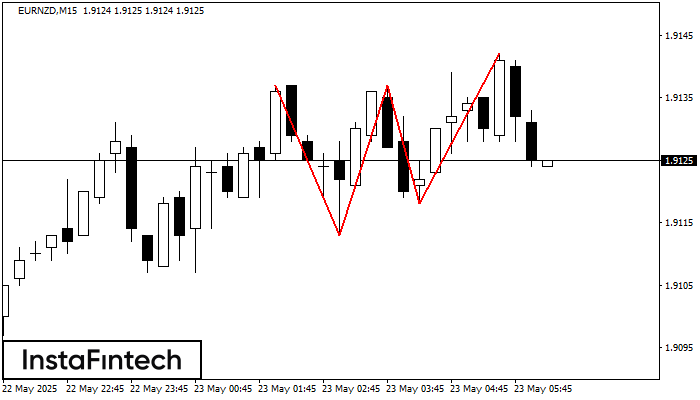
En el gráfico del instrumento de negociación EURNZD M15, se ha formado el patrón Triple Techo que señala un cambio en la tendencia. Es posible que después de la formación
Los marcos de tiempo M5 y M15 pueden tener más puntos de entrada falsos.
Open chart in a new window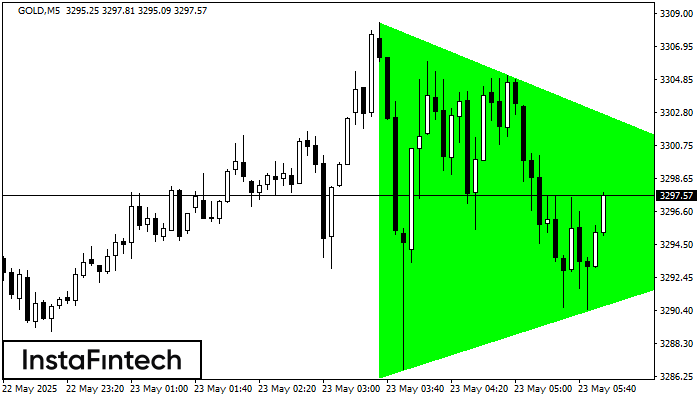
Según el gráfico de M5, el GOLD formó el patrón Triángulo Simétrico Alcista. El límite inferior del patrón toca las coordenadas 3286.21/3295.95 donde el límite superior cruza 3308.46/3295.95
Los marcos de tiempo M5 y M15 pueden tener más puntos de entrada falsos.
Open chart in a new window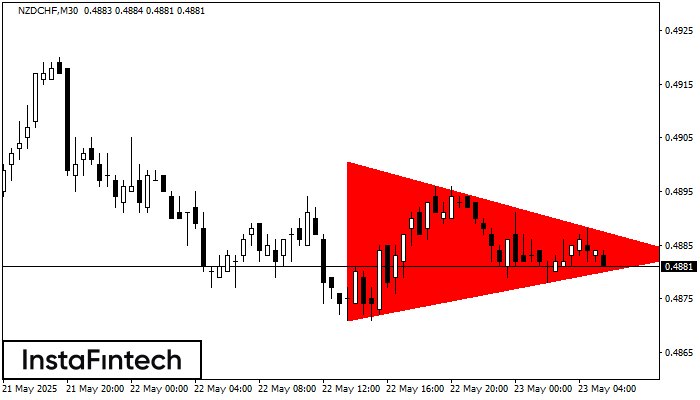
Según el gráfico de M30, el NZDCHF formó el patrón Triángulo Simétrico Bajista. Recomendaciones de negociación: es posible que una ruptura del límite inferior 0.4871 fomente una continuación
Open chart in a new window


