


signal strength 1 of 5

The Triple Bottom pattern has been formed on #Bitcoin M5. It has the following characteristics: resistance level 83143.83/82884.57; support level 82680.13/82625.22; the width is 46370 points. In the event of a breakdown of the resistance level of 83143.83, the price is likely to continue an upward movement at least to 82669.54.
The M5 and M15 time frames may have more false entry points.
See Also
- All
- Double Top
- Flag
- Head and Shoulders
- Pennant
- Rectangle
- Triangle
- Triple top
- All
- #AAPL
- #AMZN
- #Bitcoin
- #EBAY
- #FB
- #GOOG
- #INTC
- #KO
- #MA
- #MCD
- #MSFT
- #NTDOY
- #PEP
- #TSLA
- #TWTR
- AUDCAD
- AUDCHF
- AUDJPY
- AUDUSD
- EURCAD
- EURCHF
- EURGBP
- EURJPY
- EURNZD
- EURRUB
- EURUSD
- GBPAUD
- GBPCHF
- GBPJPY
- GBPUSD
- GOLD
- NZDCAD
- NZDCHF
- NZDJPY
- NZDUSD
- SILVER
- USDCAD
- USDCHF
- USDJPY
- USDRUB
- All
- M5
- M15
- M30
- H1
- D1
- All
- Buy
- Sale
- All
- 1
- 2
- 3
- 4
- 5
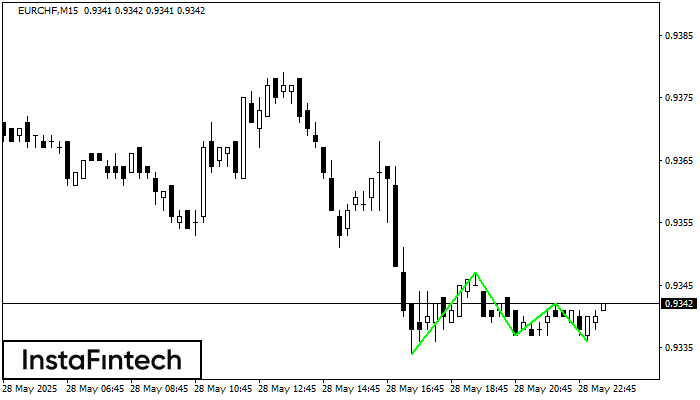
The Triple Bottom pattern has formed on the chart of EURCHF M15. Features of the pattern: The lower line of the pattern has coordinates 0.9347 with the upper limit 0.9347/0.9342
The M5 and M15 time frames may have more false entry points.
Open chart in a new window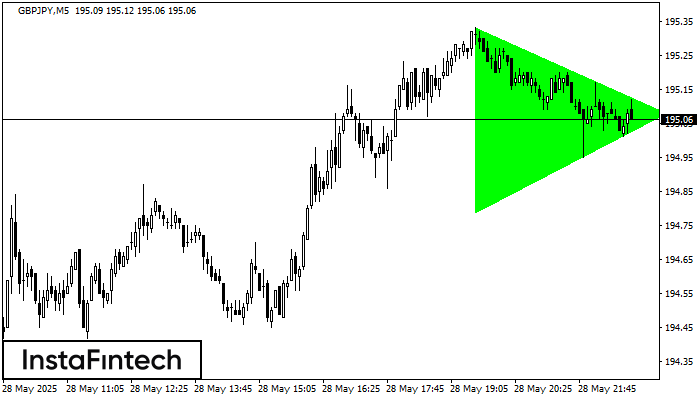
According to the chart of M5, GBPJPY formed the Bullish Symmetrical Triangle pattern. Description: This is the pattern of a trend continuation. 195.33 and 194.79 are the coordinates
The M5 and M15 time frames may have more false entry points.
Open chart in a new window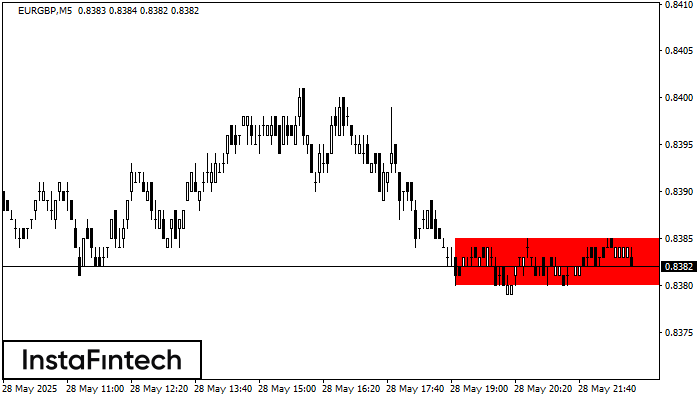
According to the chart of M5, EURGBP formed the Bearish Rectangle which is a pattern of a trend continuation. The pattern is contained within the following borders: lower border 0.8380
The M5 and M15 time frames may have more false entry points.
Open chart in a new window


