


signal strength 1 of 5
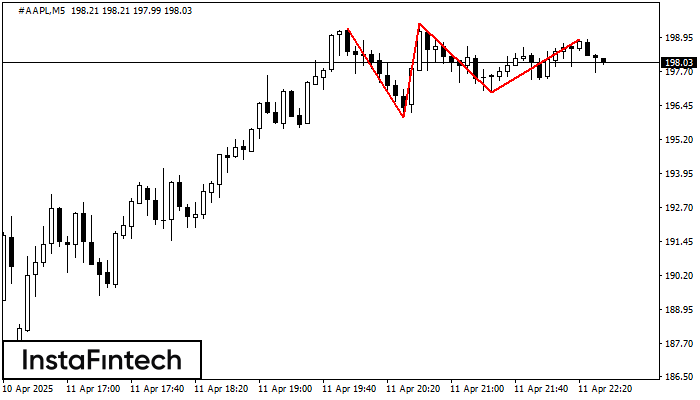
On the chart of the #AAPL M5 trading instrument, the Triple Top pattern that signals a trend change has formed. It is possible that after formation of the third peak, the price will try to break through the resistance level 196.03, where we advise to open a trading position for sale. Take profit is the projection of the pattern’s width, which is 327 points.
The M5 and M15 time frames may have more false entry points.
See Also
- All
- Double Top
- Flag
- Head and Shoulders
- Pennant
- Rectangle
- Triangle
- Triple top
- All
- #AAPL
- #AMZN
- #Bitcoin
- #EBAY
- #FB
- #GOOG
- #INTC
- #KO
- #MA
- #MCD
- #MSFT
- #NTDOY
- #PEP
- #TSLA
- #TWTR
- AUDCAD
- AUDCHF
- AUDJPY
- AUDUSD
- EURCAD
- EURCHF
- EURGBP
- EURJPY
- EURNZD
- EURRUB
- EURUSD
- GBPAUD
- GBPCHF
- GBPJPY
- GBPUSD
- GOLD
- NZDCAD
- NZDCHF
- NZDJPY
- NZDUSD
- SILVER
- USDCAD
- USDCHF
- USDJPY
- USDRUB
- All
- M5
- M15
- M30
- H1
- D1
- All
- Buy
- Sale
- All
- 1
- 2
- 3
- 4
- 5

According to the chart of M30, EURUSD formed the Bullish Symmetrical Triangle pattern, which signals the trend will continue. Description. The upper border of the pattern touches the coordinates 1.1362/1.1333
Open chart in a new window
The Bearish pennant pattern has formed on the NZDCAD H1 chart. The pattern signals continuation of the downtrend in case the pennant’s low of 0.8197 is broken through. Recommendations: Place
Open chart in a new window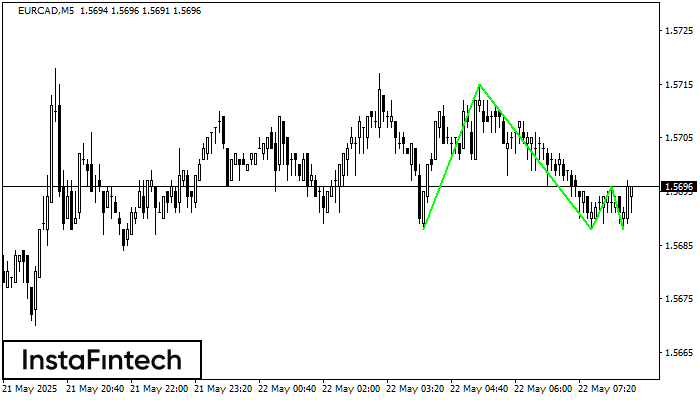
The Triple Bottom pattern has formed on the chart of EURCAD M5. Features of the pattern: The lower line of the pattern has coordinates 1.5715 with the upper limit 1.5715/1.5696
The M5 and M15 time frames may have more false entry points.
Open chart in a new window


