


signal strength 1 of 5
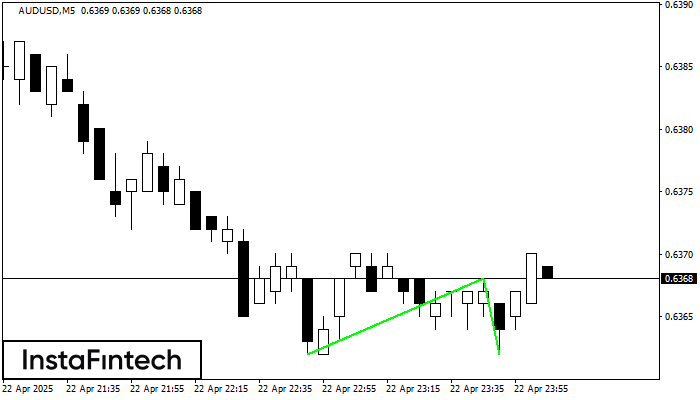
The Double Bottom pattern has been formed on AUDUSD M5; the upper boundary is 0.6368; the lower boundary is 0.6362. The width of the pattern is 6 points. In case of a break of the upper boundary 0.6368, a change in the trend can be predicted where the width of the pattern will coincide with the distance to a possible take profit level.
The M5 and M15 time frames may have more false entry points.
- All
- Double Top
- Flag
- Head and Shoulders
- Pennant
- Rectangle
- Triangle
- Triple top
- All
- #AAPL
- #AMZN
- #Bitcoin
- #EBAY
- #FB
- #GOOG
- #INTC
- #KO
- #MA
- #MCD
- #MSFT
- #NTDOY
- #PEP
- #TSLA
- #TWTR
- AUDCAD
- AUDCHF
- AUDJPY
- AUDUSD
- EURCAD
- EURCHF
- EURGBP
- EURJPY
- EURNZD
- EURRUB
- EURUSD
- GBPAUD
- GBPCHF
- GBPJPY
- GBPUSD
- GOLD
- NZDCAD
- NZDCHF
- NZDJPY
- NZDUSD
- SILVER
- USDCAD
- USDCHF
- USDJPY
- USDRUB
- All
- M5
- M15
- M30
- H1
- D1
- All
- Buy
- Sale
- All
- 1
- 2
- 3
- 4
- 5
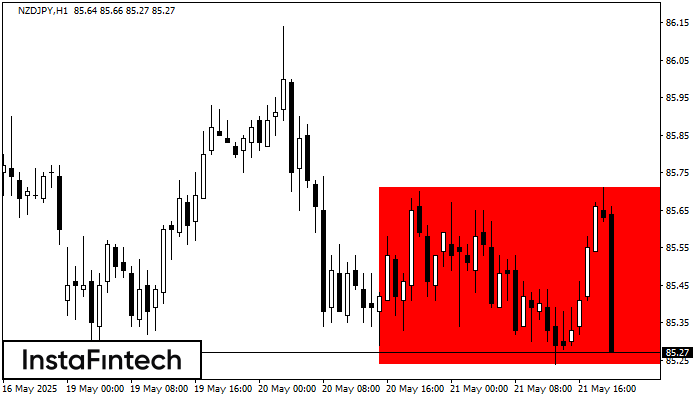
Según el gráfico de H1, NZDJPY formó el Rectángulo Bajista que es un patrón de la continuación de una tendencia. El patrón está contenido dentro de los siguientes límites: límite
Open chart in a new window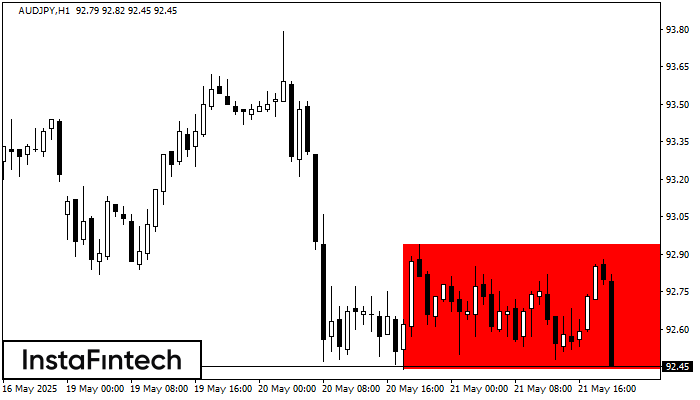
Según el gráfico de H1, AUDJPY formó el Rectángulo Bajista. El patrón indica la continuación de una tendencia. El límite superior es 92.94, el límite inferior es 92.44. La señal
Open chart in a new window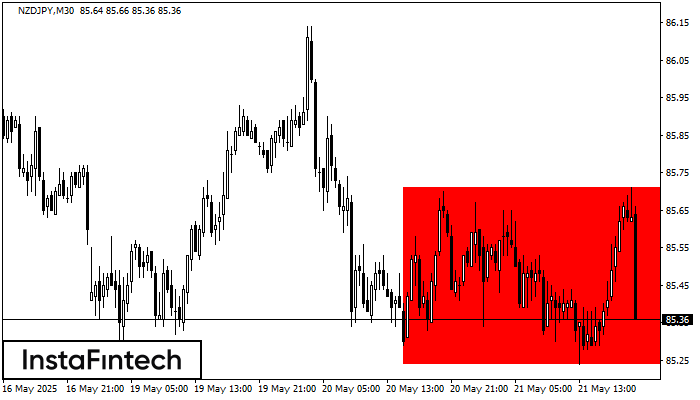
Según el gráfico de M30, NZDJPY formó el Rectángulo Bajista que es un patrón de la continuación de una tendencia. El patrón está contenido dentro de los siguientes límites: límite
Open chart in a new window


