

signal strength 1 of 5
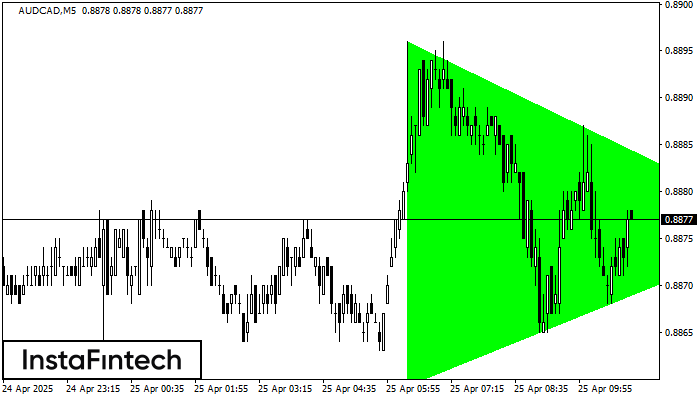
According to the chart of M5, AUDCAD formed the Bullish Symmetrical Triangle pattern, which signals the trend will continue. Description. The upper border of the pattern touches the coordinates 0.8896/0.8876 whereas the lower border goes across 0.8859/0.8876. The pattern width is measured on the chart at 37 pips. If the Bullish Symmetrical Triangle pattern is in progress during the upward trend, this indicates the current trend will go on. In case 0.8876 is broken, the price could continue its move toward 0.8891.
The M5 and M15 time frames may have more false entry points.
- All
- Double Top
- Flag
- Head and Shoulders
- Pennant
- Rectangle
- Triangle
- Triple top
- All
- #AAPL
- #AMZN
- #Bitcoin
- #EBAY
- #FB
- #GOOG
- #INTC
- #KO
- #MA
- #MCD
- #MSFT
- #NTDOY
- #PEP
- #TSLA
- #TWTR
- AUDCAD
- AUDCHF
- AUDJPY
- AUDUSD
- EURCAD
- EURCHF
- EURGBP
- EURJPY
- EURNZD
- EURRUB
- EURUSD
- GBPAUD
- GBPCHF
- GBPJPY
- GBPUSD
- GOLD
- NZDCAD
- NZDCHF
- NZDJPY
- NZDUSD
- SILVER
- USDCAD
- USDCHF
- USDJPY
- USDRUB
- All
- M5
- M15
- M30
- H1
- D1
- All
- Buy
- Sale
- All
- 1
- 2
- 3
- 4
- 5
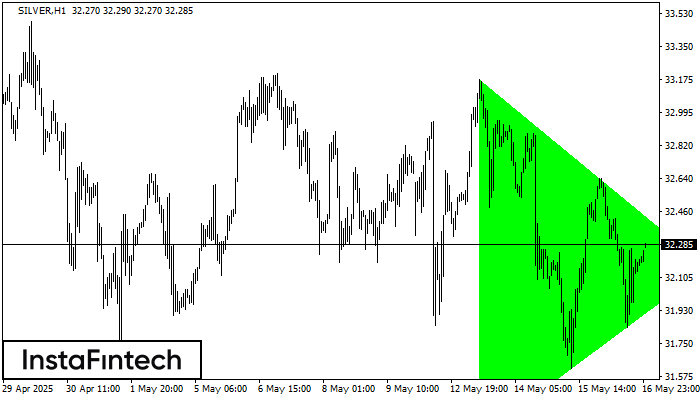
Según el gráfico de H1, SILVER formó el patrón Triángulo Simétrico Alcista, que señala que la tendencia continuará. Descripción. El límite superior del patrón toca las coordenadas 33.17/32.16 donde
Open chart in a new window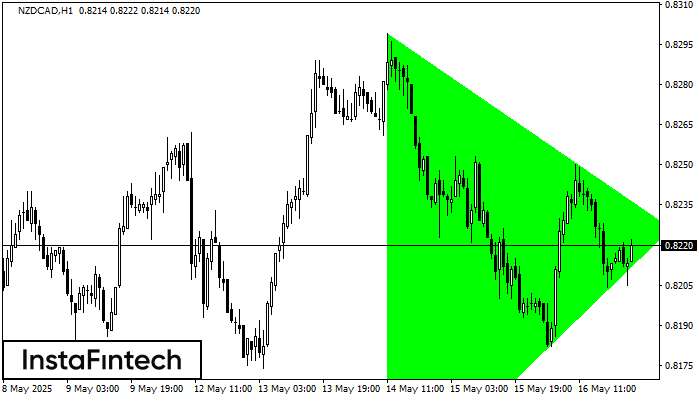
Según el gráfico de H1, NZDCAD formó el patrón Triángulo Simétrico Alcista, que señala que la tendencia continuará. Descripción. El límite superior del patrón toca las coordenadas 0.8299/0.8226 donde
Open chart in a new window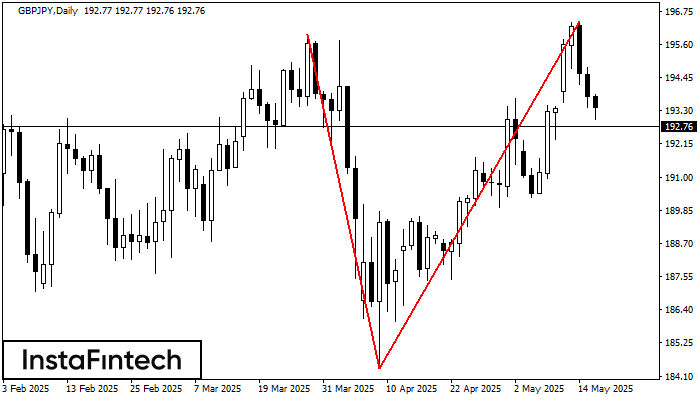
El patrón de reversión Doble Techo ha sido formado en GBPJPY D1. Características: el límite superior 195.94; el límite inferior 184.35; el ancho del patrón es 1203 puntos. Es mejor
Open chart in a new window


