

signal strength 2 of 5
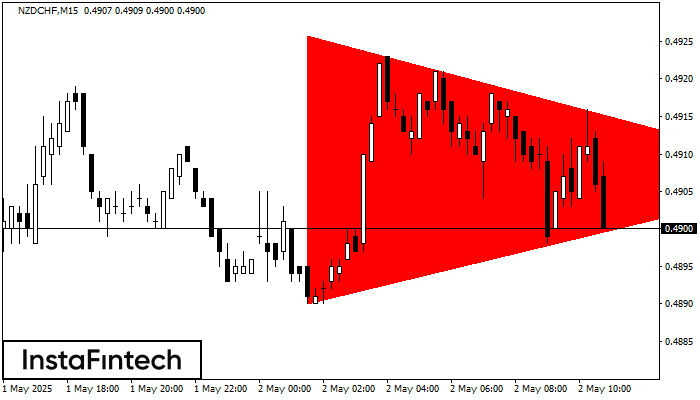
According to the chart of M15, NZDCHF formed the Bearish Symmetrical Triangle pattern. Description: The lower border is 0.4890/0.4907 and upper border is 0.4926/0.4907. The pattern width is measured on the chart at -36 pips. The formation of the Bearish Symmetrical Triangle pattern evidently signals a continuation of the downward trend. In other words, if the scenario comes true and NZDCHF breaches the lower border, the price could continue its move toward 0.4884.
The M5 and M15 time frames may have more false entry points.
See Also
- All
- Double Top
- Flag
- Head and Shoulders
- Pennant
- Rectangle
- Triangle
- Triple top
- All
- #AAPL
- #AMZN
- #Bitcoin
- #EBAY
- #FB
- #GOOG
- #INTC
- #KO
- #MA
- #MCD
- #MSFT
- #NTDOY
- #PEP
- #TSLA
- #TWTR
- AUDCAD
- AUDCHF
- AUDJPY
- AUDUSD
- EURCAD
- EURCHF
- EURGBP
- EURJPY
- EURNZD
- EURRUB
- EURUSD
- GBPAUD
- GBPCHF
- GBPJPY
- GBPUSD
- GOLD
- NZDCAD
- NZDCHF
- NZDJPY
- NZDUSD
- SILVER
- USDCAD
- USDCHF
- USDJPY
- USDRUB
- All
- M5
- M15
- M30
- H1
- D1
- All
- Buy
- Sale
- All
- 1
- 2
- 3
- 4
- 5

The Bearish pennant pattern has formed on the #NTDOY M15 chart. It signals potential continuation of the existing trend. Specifications: the pattern’s bottom has the coordinate of 21.51; the projection
The M5 and M15 time frames may have more false entry points.
Open chart in a new window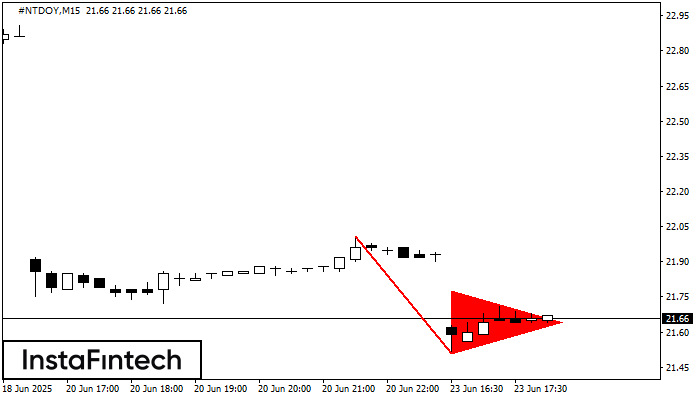
The Bearish pennant pattern has formed on the #NTDOY M15 chart. It signals potential continuation of the existing trend. Specifications: the pattern’s bottom has the coordinate of 21.51; the projection
The M5 and M15 time frames may have more false entry points.
Open chart in a new window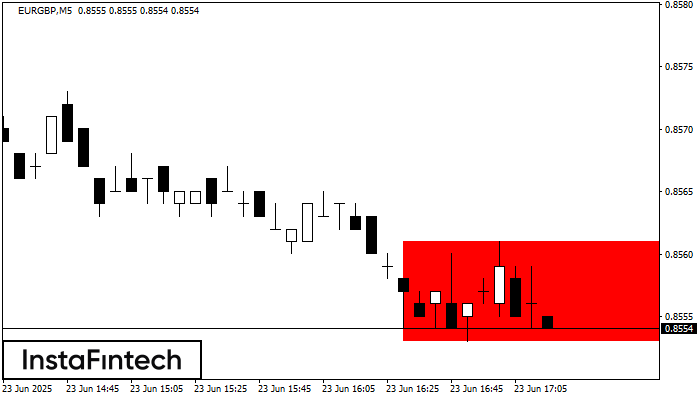
According to the chart of M5, EURGBP formed the Bearish Rectangle. This type of a pattern indicates a trend continuation. It consists of two levels: resistance 0.8561 - 0.0000
The M5 and M15 time frames may have more false entry points.
Open chart in a new window


