

signal strength 4 of 5
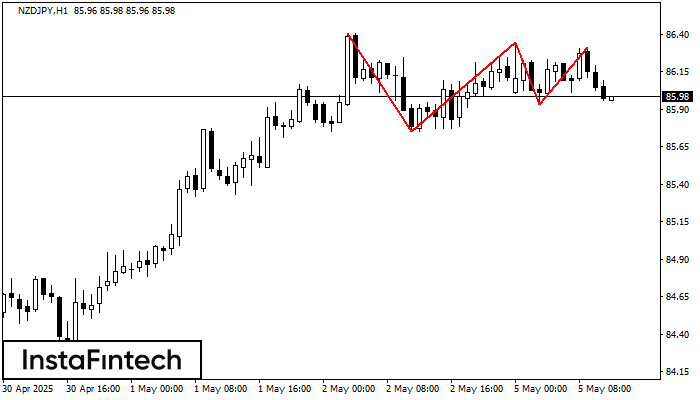
The Triple Top pattern has formed on the chart of the NZDJPY H1. Features of the pattern: borders have an ascending angle; the lower line of the pattern has the coordinates 85.75/85.93 with the upper limit 86.40/86.31; the projection of the width is 65 points. The formation of the Triple Top figure most likely indicates a change in the trend from upward to downward. This means that in the event of a breakdown of the support level of 85.75, the price is most likely to continue the downward movement.
See Also
- All
- Double Top
- Flag
- Head and Shoulders
- Pennant
- Rectangle
- Triangle
- Triple top
- All
- #AAPL
- #AMZN
- #Bitcoin
- #EBAY
- #FB
- #GOOG
- #INTC
- #KO
- #MA
- #MCD
- #MSFT
- #NTDOY
- #PEP
- #TSLA
- #TWTR
- AUDCAD
- AUDCHF
- AUDJPY
- AUDUSD
- EURCAD
- EURCHF
- EURGBP
- EURJPY
- EURNZD
- EURRUB
- EURUSD
- GBPAUD
- GBPCHF
- GBPJPY
- GBPUSD
- GOLD
- NZDCAD
- NZDCHF
- NZDJPY
- NZDUSD
- SILVER
- USDCAD
- USDCHF
- USDJPY
- USDRUB
- All
- M5
- M15
- M30
- H1
- D1
- All
- Buy
- Sale
- All
- 1
- 2
- 3
- 4
- 5
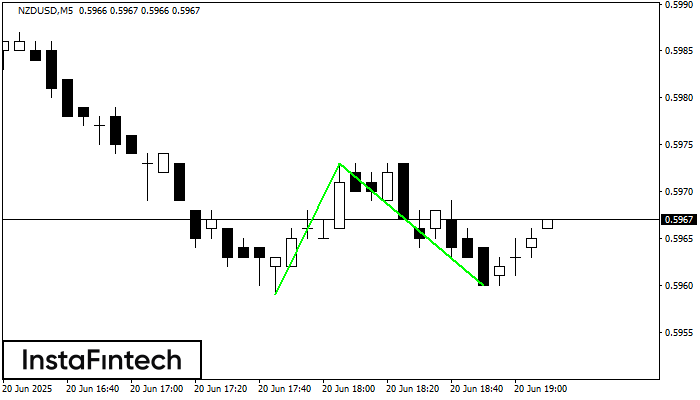
The Double Bottom pattern has been formed on NZDUSD M5. Characteristics: the support level 0.5959; the resistance level 0.5973; the width of the pattern 14 points. If the resistance level
The M5 and M15 time frames may have more false entry points.
Open chart in a new window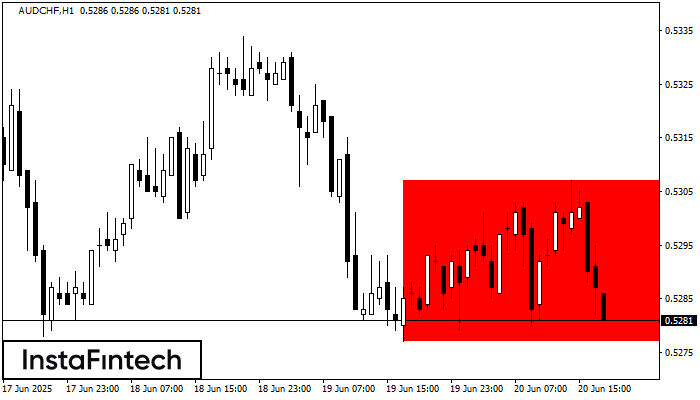
According to the chart of H1, AUDCHF formed the Bearish Rectangle. The pattern indicates a trend continuation. The upper border is 0.5307, the lower border is 0.5277. The signal means
Open chart in a new window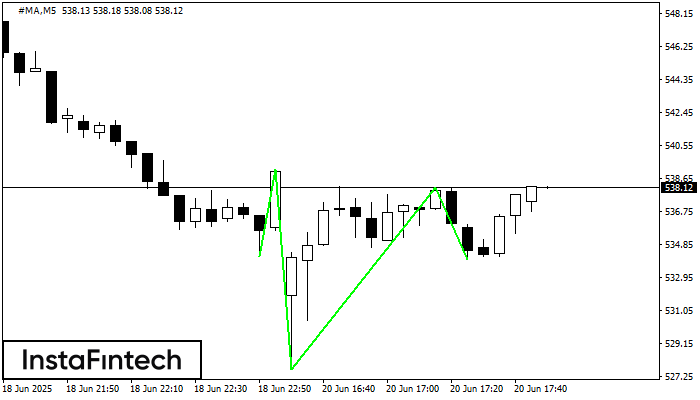
According to the chart of M5, #MA formed the Inverse Head and Shoulder pattern. The Head’s top is set at 538.15 while the median line of the Neck is found
The M5 and M15 time frames may have more false entry points.
Open chart in a new window


