


signal strength 1 of 5
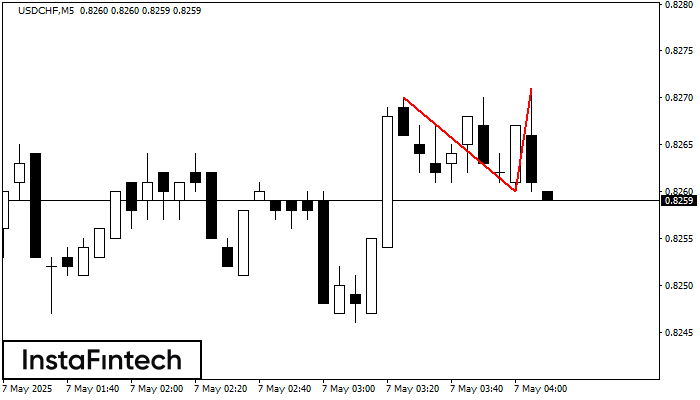
The Double Top reversal pattern has been formed on USDCHF M5. Characteristics: the upper boundary 0.8270; the lower boundary 0.8260; the width of the pattern is 11 points. Sell trades are better to be opened below the lower boundary 0.8260 with a possible movements towards the 0.8245 level.
The M5 and M15 time frames may have more false entry points.
See Also
- All
- Double Top
- Flag
- Head and Shoulders
- Pennant
- Rectangle
- Triangle
- Triple top
- All
- #AAPL
- #AMZN
- #Bitcoin
- #EBAY
- #FB
- #GOOG
- #INTC
- #KO
- #MA
- #MCD
- #MSFT
- #NTDOY
- #PEP
- #TSLA
- #TWTR
- AUDCAD
- AUDCHF
- AUDJPY
- AUDUSD
- EURCAD
- EURCHF
- EURGBP
- EURJPY
- EURNZD
- EURRUB
- EURUSD
- GBPAUD
- GBPCHF
- GBPJPY
- GBPUSD
- GOLD
- NZDCAD
- NZDCHF
- NZDJPY
- NZDUSD
- SILVER
- USDCAD
- USDCHF
- USDJPY
- USDRUB
- All
- M5
- M15
- M30
- H1
- D1
- All
- Buy
- Sale
- All
- 1
- 2
- 3
- 4
- 5
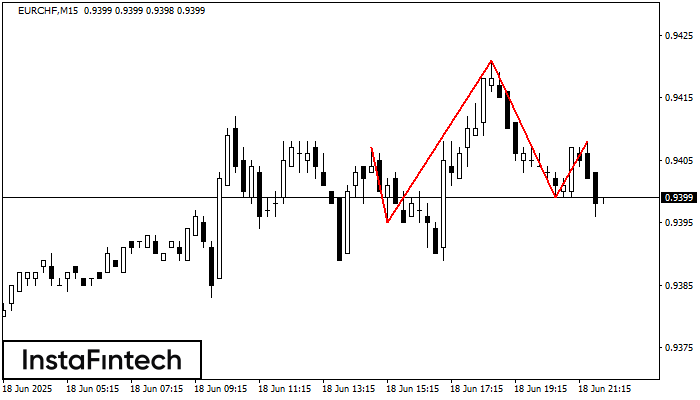
The technical pattern called Head and Shoulders has appeared on the chart of EURCHF M15. There are weighty reasons to suggest that the price will surpass the Neckline 0.9395/0.9399 after
The M5 and M15 time frames may have more false entry points.
Open chart in a new window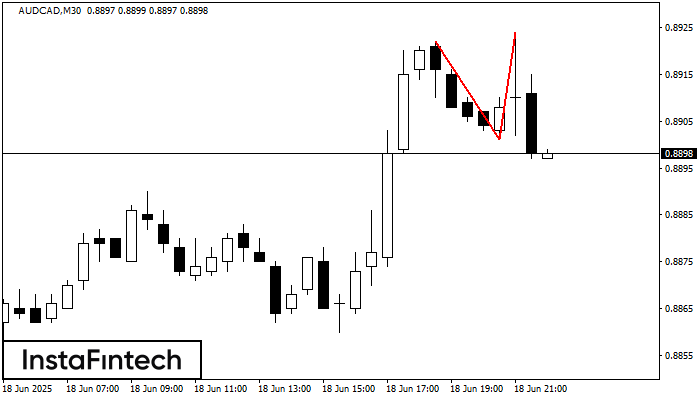
The Double Top pattern has been formed on AUDCAD M30. It signals that the trend has been changed from upwards to downwards. Probably, if the base of the pattern 0.8901
Open chart in a new window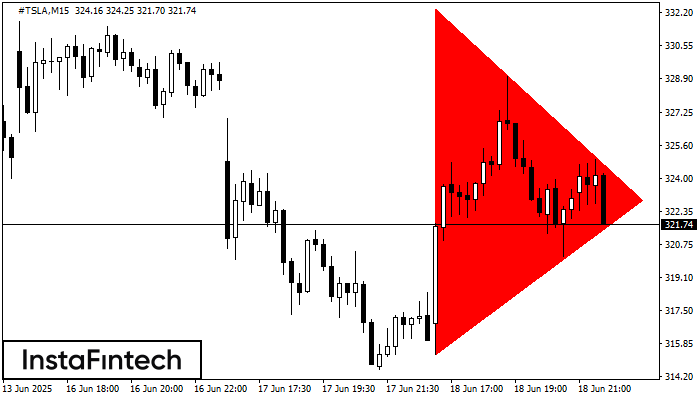
According to the chart of M15, #TSLA formed the Bearish Symmetrical Triangle pattern. This pattern signals a further downward trend in case the lower border 315.29 is breached. Here
The M5 and M15 time frames may have more false entry points.
Open chart in a new window


