

signal strength 2 of 5
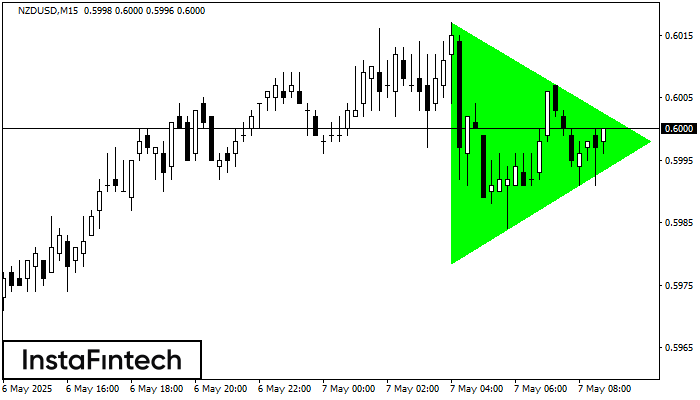
According to the chart of M15, NZDUSD formed the Bullish Symmetrical Triangle pattern. The lower border of the pattern touches the coordinates 0.5979/0.5998 whereas the upper border goes across 0.6017/0.5998. If the Bullish Symmetrical Triangle pattern is in progress, this evidently signals a further upward trend. In other words, in case the scenario comes true, the price of NZDUSD will breach the upper border to head for 0.6021.
The M5 and M15 time frames may have more false entry points.
See Also
- All
- Double Top
- Flag
- Head and Shoulders
- Pennant
- Rectangle
- Triangle
- Triple top
- All
- #AAPL
- #AMZN
- #Bitcoin
- #EBAY
- #FB
- #GOOG
- #INTC
- #KO
- #MA
- #MCD
- #MSFT
- #NTDOY
- #PEP
- #TSLA
- #TWTR
- AUDCAD
- AUDCHF
- AUDJPY
- AUDUSD
- EURCAD
- EURCHF
- EURGBP
- EURJPY
- EURNZD
- EURRUB
- EURUSD
- GBPAUD
- GBPCHF
- GBPJPY
- GBPUSD
- GOLD
- NZDCAD
- NZDCHF
- NZDJPY
- NZDUSD
- SILVER
- USDCAD
- USDCHF
- USDJPY
- USDRUB
- All
- M5
- M15
- M30
- H1
- D1
- All
- Buy
- Sale
- All
- 1
- 2
- 3
- 4
- 5
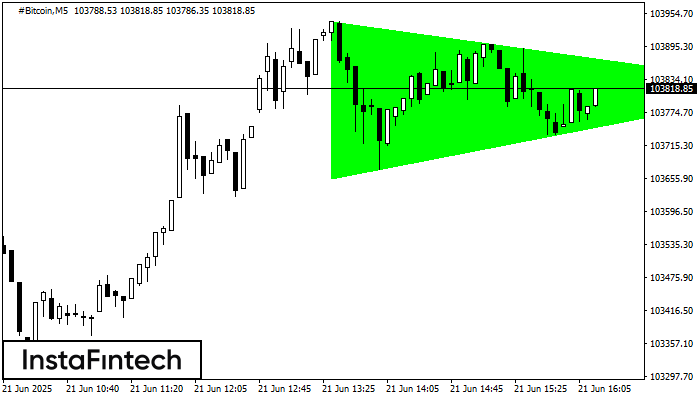
Según el gráfico de M5, el #Bitcoin formó el patrón Triángulo Simétrico Alcista. El límite inferior del patrón toca las coordenadas 103655.19/103820.77 donde el límite superior cruza 103940.04/103820.77
Los marcos de tiempo M5 y M15 pueden tener más puntos de entrada falsos.
Open chart in a new window
El patrón Triple Piso ha sido formado en GOLD M5. Este tiene las siguientes características: nivel de resistencia 3372.86/3370.25; nivel de soporte 3364.73/3364.26; el ancho es 813 puntos. En caso
Los marcos de tiempo M5 y M15 pueden tener más puntos de entrada falsos.
Open chart in a new window
Según el gráfico de M15, #GOOG formó el Rectángulo Bajista. El patrón indica la continuación de una tendencia. El límite superior es 170.41, el límite inferior es 169.00. La señal
Los marcos de tiempo M5 y M15 pueden tener más puntos de entrada falsos.
Open chart in a new window


