


signal strength 1 of 5
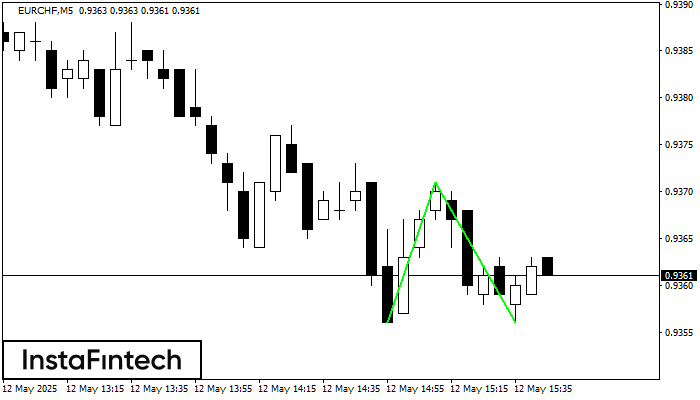
The Double Bottom pattern has been formed on EURCHF M5; the upper boundary is 0.9371; the lower boundary is 0.9356. The width of the pattern is 15 points. In case of a break of the upper boundary 0.9371, a change in the trend can be predicted where the width of the pattern will coincide with the distance to a possible take profit level.
The M5 and M15 time frames may have more false entry points.
See Also
- All
- Double Top
- Flag
- Head and Shoulders
- Pennant
- Rectangle
- Triangle
- Triple top
- All
- #AAPL
- #AMZN
- #Bitcoin
- #EBAY
- #FB
- #GOOG
- #INTC
- #KO
- #MA
- #MCD
- #MSFT
- #NTDOY
- #PEP
- #TSLA
- #TWTR
- AUDCAD
- AUDCHF
- AUDJPY
- AUDUSD
- EURCAD
- EURCHF
- EURGBP
- EURJPY
- EURNZD
- EURRUB
- EURUSD
- GBPAUD
- GBPCHF
- GBPJPY
- GBPUSD
- GOLD
- NZDCAD
- NZDCHF
- NZDJPY
- NZDUSD
- SILVER
- USDCAD
- USDCHF
- USDJPY
- USDRUB
- All
- M5
- M15
- M30
- H1
- D1
- All
- Buy
- Sale
- All
- 1
- 2
- 3
- 4
- 5

The Triple Bottom pattern has been formed on GOLD M5. It has the following characteristics: resistance level 3372.86/3370.25; support level 3364.73/3364.26; the width is 813 points. In the event
The M5 and M15 time frames may have more false entry points.
Open chart in a new window
According to the chart of M15, #GOOG formed the Bearish Rectangle. The pattern indicates a trend continuation. The upper border is 170.41, the lower border is 169.00. The signal means
The M5 and M15 time frames may have more false entry points.
Open chart in a new window
According to the chart of M5, #TSLA formed the Bearish Symmetrical Triangle pattern. This pattern signals a further downward trend in case the lower border 317.55 is breached. Here
The M5 and M15 time frames may have more false entry points.
Open chart in a new window


