


signal strength 1 of 5
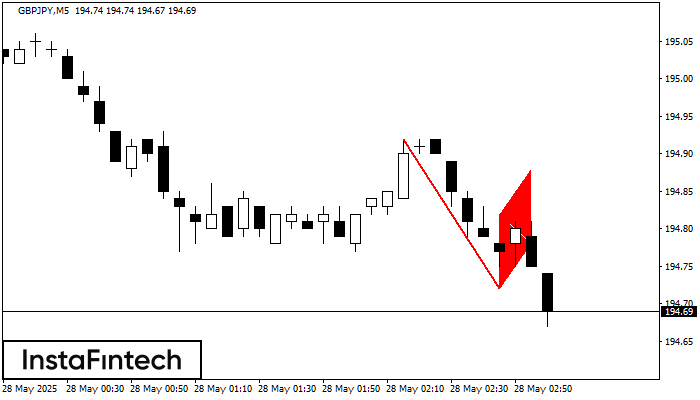
The Bearish Flag pattern has been formed on the chart GBPJPY M5. Therefore, the downwards trend is likely to continue in the nearest term. As soon as the price breaks below the low at 194.72, traders should enter the market.
The M5 and M15 time frames may have more false entry points.
- All
- Double Top
- Flag
- Head and Shoulders
- Pennant
- Rectangle
- Triangle
- Triple top
- All
- #AAPL
- #AMZN
- #Bitcoin
- #EBAY
- #FB
- #GOOG
- #INTC
- #KO
- #MA
- #MCD
- #MSFT
- #NTDOY
- #PEP
- #TSLA
- #TWTR
- AUDCAD
- AUDCHF
- AUDJPY
- AUDUSD
- EURCAD
- EURCHF
- EURGBP
- EURJPY
- EURNZD
- EURRUB
- EURUSD
- GBPAUD
- GBPCHF
- GBPJPY
- GBPUSD
- GOLD
- NZDCAD
- NZDCHF
- NZDJPY
- NZDUSD
- SILVER
- USDCAD
- USDCHF
- USDJPY
- USDRUB
- All
- M5
- M15
- M30
- H1
- D1
- All
- Buy
- Sale
- All
- 1
- 2
- 3
- 4
- 5
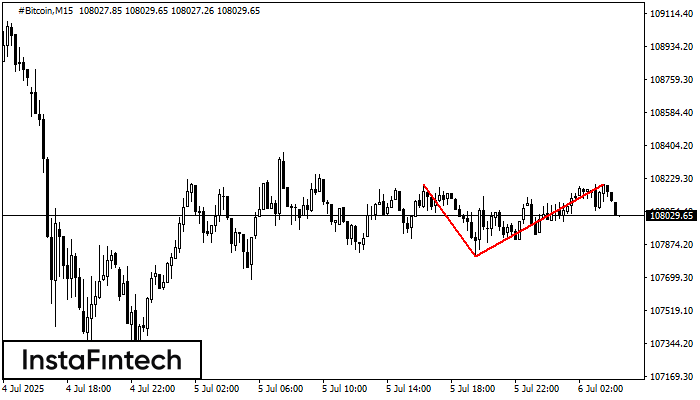
On the chart of #Bitcoin M15 the Double Top reversal pattern has been formed. Characteristics: the upper boundary 108196.50; the lower boundary 107810.44; the width of the pattern 38606 points
The M5 and M15 time frames may have more false entry points.
Открыть график инструмента в новом окне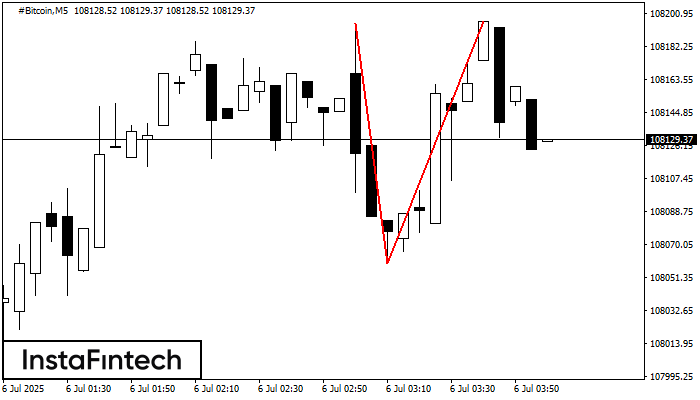
The Double Top pattern has been formed on #Bitcoin M5. It signals that the trend has been changed from upwards to downwards. Probably, if the base of the pattern 108059.29
The M5 and M15 time frames may have more false entry points.
Открыть график инструмента в новом окне
According to the chart of M5, #Bitcoin formed the Bearish Symmetrical Triangle pattern. Trading recommendations: A breach of the lower border 107810.44 is likely to encourage a continuation
The M5 and M15 time frames may have more false entry points.
Открыть график инструмента в новом окне


