


signal strength 1 of 5

The Bullish Flag pattern has been formed on #TSLA at M5. The lower boundary of the pattern is located at 306.79/305.77, while the higher boundary lies at 309.97/308.95. The projection of the flagpole is 949 points. This formation signals that the upward trend is most likely to continue. Therefore, if the level of 309.97 is broken, the price will move further upwards.
The M5 and M15 time frames may have more false entry points.
See Also
- All
- Double Top
- Flag
- Head and Shoulders
- Pennant
- Rectangle
- Triangle
- Triple top
- All
- #AAPL
- #AMZN
- #Bitcoin
- #EBAY
- #FB
- #GOOG
- #INTC
- #KO
- #MA
- #MCD
- #MSFT
- #NTDOY
- #PEP
- #TSLA
- #TWTR
- AUDCAD
- AUDCHF
- AUDJPY
- AUDUSD
- EURCAD
- EURCHF
- EURGBP
- EURJPY
- EURNZD
- EURRUB
- EURUSD
- GBPAUD
- GBPCHF
- GBPJPY
- GBPUSD
- GOLD
- NZDCAD
- NZDCHF
- NZDJPY
- NZDUSD
- SILVER
- USDCAD
- USDCHF
- USDJPY
- USDRUB
- All
- M5
- M15
- M30
- H1
- D1
- All
- Buy
- Sale
- All
- 1
- 2
- 3
- 4
- 5
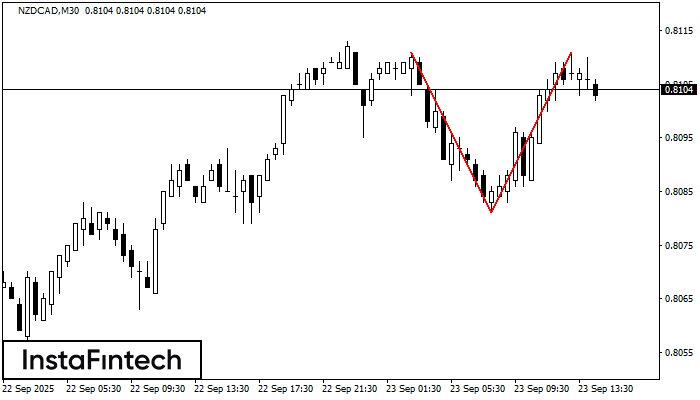
On the chart of NZDCAD M30 the Double Top reversal pattern has been formed. Characteristics: the upper boundary 0.8111; the lower boundary 0.8081; the width of the pattern 30 points
Open chart in a new window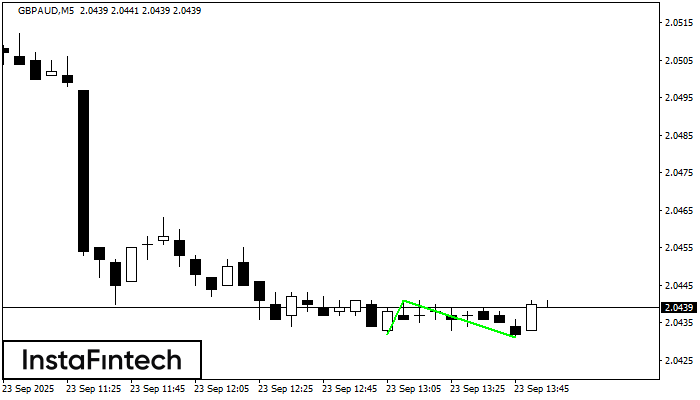
The Double Bottom pattern has been formed on GBPAUD M5. Characteristics: the support level 2.0432; the resistance level 2.0441; the width of the pattern 9 points. If the resistance level
The M5 and M15 time frames may have more false entry points.
Open chart in a new window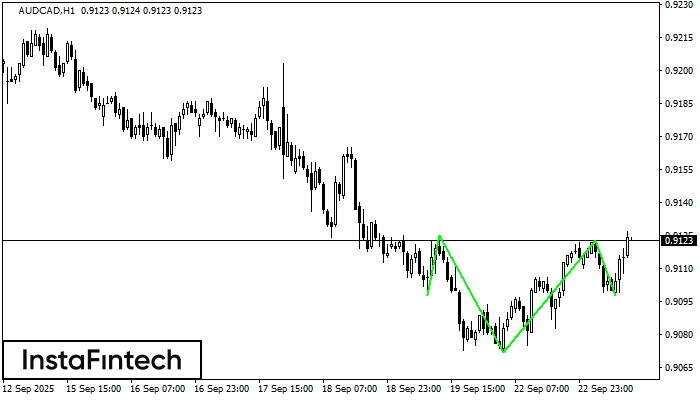
According to H1, AUDCAD is shaping the technical pattern – the Inverse Head and Shoulder. In case the Neckline 0.9125/0.9123 is broken out, the instrument is likely to move toward
Open chart in a new window


