

signal strength 3 of 5
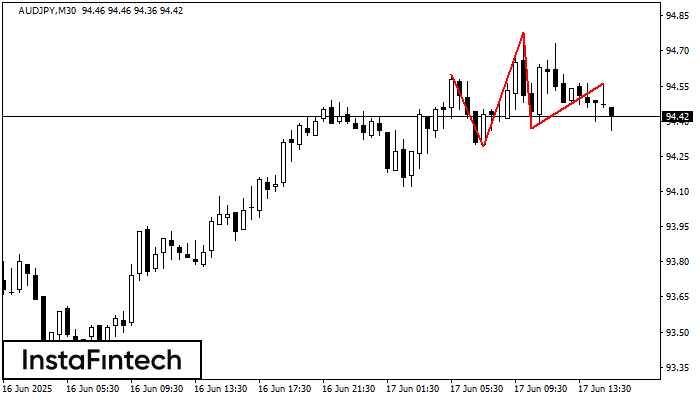
The AUDJPY M30 formed the Head and Shoulders pattern with the following features: The Head’s top is at 94.78, the Neckline and the upward angle are at 94.29/94.37. The formation of this pattern can bring about changes in the current trend from bullish to bearish. In case the pattern triggers the expected changes, the price of AUDJPY will go towards 94.07.
See Also
- All
- Double Top
- Flag
- Head and Shoulders
- Pennant
- Rectangle
- Triangle
- Triple top
- All
- #AAPL
- #AMZN
- #Bitcoin
- #EBAY
- #FB
- #GOOG
- #INTC
- #KO
- #MA
- #MCD
- #MSFT
- #NTDOY
- #PEP
- #TSLA
- #TWTR
- AUDCAD
- AUDCHF
- AUDJPY
- AUDUSD
- EURCAD
- EURCHF
- EURGBP
- EURJPY
- EURNZD
- EURRUB
- EURUSD
- GBPAUD
- GBPCHF
- GBPJPY
- GBPUSD
- GOLD
- NZDCAD
- NZDCHF
- NZDJPY
- NZDUSD
- SILVER
- USDCAD
- USDCHF
- USDJPY
- USDRUB
- All
- M5
- M15
- M30
- H1
- D1
- All
- Buy
- Sale
- All
- 1
- 2
- 3
- 4
- 5
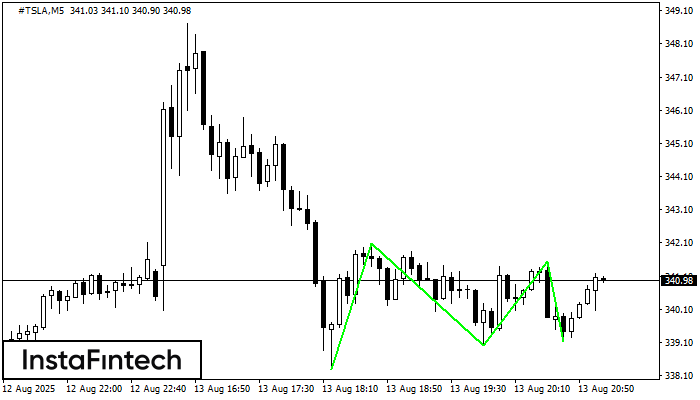
The Triple Bottom pattern has been formed on #TSLA M5. It has the following characteristics: resistance level 342.09/341.55; support level 338.30/339.14; the width is 379 points. In the event
The M5 and M15 time frames may have more false entry points.
Open chart in a new window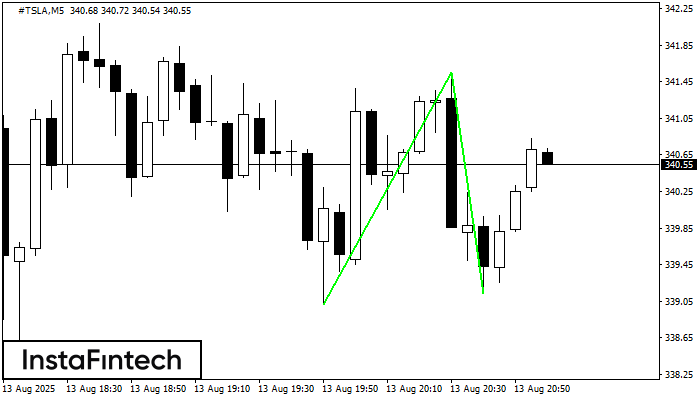
The Double Bottom pattern has been formed on #TSLA M5. Characteristics: the support level 339.01; the resistance level 341.55; the width of the pattern 254 points. If the resistance level
The M5 and M15 time frames may have more false entry points.
Open chart in a new window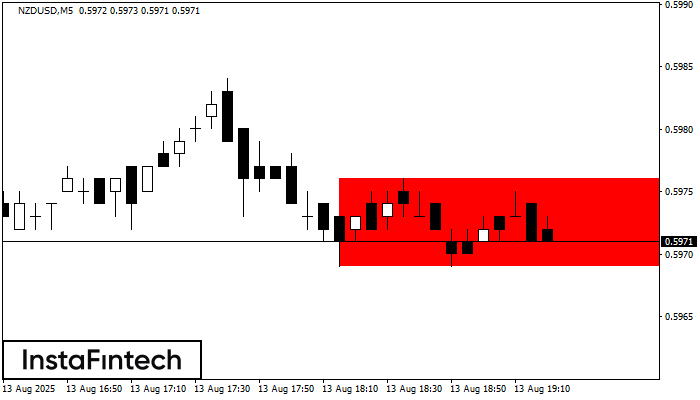
According to the chart of M5, NZDUSD formed the Bearish Rectangle. The pattern indicates a trend continuation. The upper border is 0.5976, the lower border is 0.5969. The signal means
The M5 and M15 time frames may have more false entry points.
Open chart in a new window


