

signal strength 1 of 5
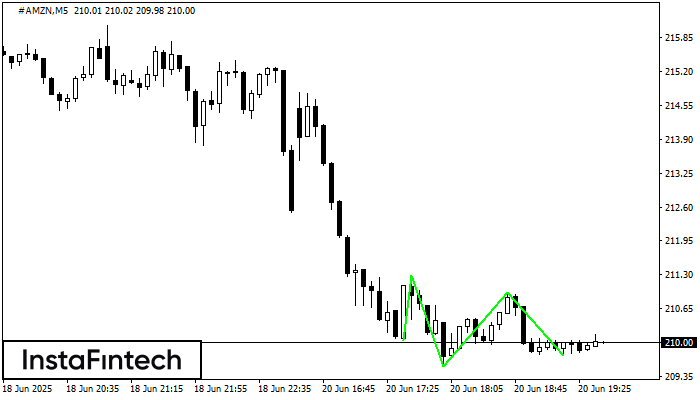
The Triple Bottom pattern has been formed on #AMZN M5. It has the following characteristics: resistance level 211.29/210.97; support level 210.03/209.76; the width is 126 points. In the event of a breakdown of the resistance level of 211.29, the price is likely to continue an upward movement at least to 209.69.
The M5 and M15 time frames may have more false entry points.
See Also
- All
- Double Top
- Flag
- Head and Shoulders
- Pennant
- Rectangle
- Triangle
- Triple top
- All
- #AAPL
- #AMZN
- #Bitcoin
- #EBAY
- #FB
- #GOOG
- #INTC
- #KO
- #MA
- #MCD
- #MSFT
- #NTDOY
- #PEP
- #TSLA
- #TWTR
- AUDCAD
- AUDCHF
- AUDJPY
- AUDUSD
- EURCAD
- EURCHF
- EURGBP
- EURJPY
- EURNZD
- EURRUB
- EURUSD
- GBPAUD
- GBPCHF
- GBPJPY
- GBPUSD
- GOLD
- NZDCAD
- NZDCHF
- NZDJPY
- NZDUSD
- SILVER
- USDCAD
- USDCHF
- USDJPY
- USDRUB
- All
- M5
- M15
- M30
- H1
- D1
- All
- Buy
- Sale
- All
- 1
- 2
- 3
- 4
- 5
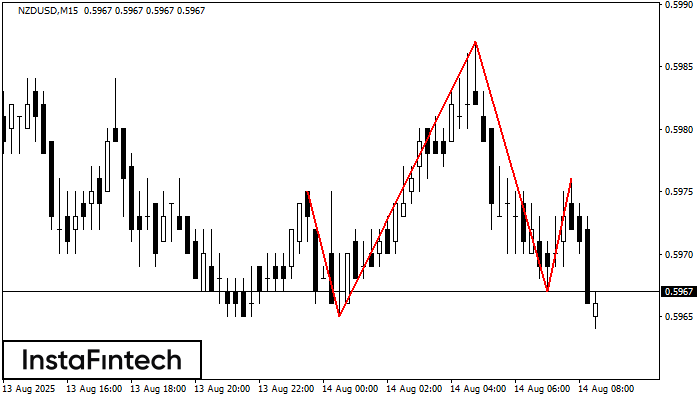
The NZDUSD M15 formed the Head and Shoulders pattern with the following features: The Head’s top is at 0.5987, the Neckline and the upward angle are at 0.5965/0.5967. The formation
The M5 and M15 time frames may have more false entry points.
Open chart in a new window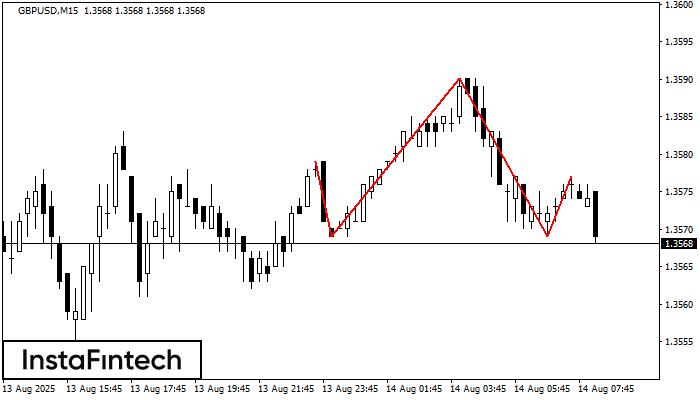
According to the chart of M15, GBPUSD formed the Head and Shoulders pattern. The Head’s top is set at 1.3590 while the median line of the Neck is found
The M5 and M15 time frames may have more false entry points.
Open chart in a new window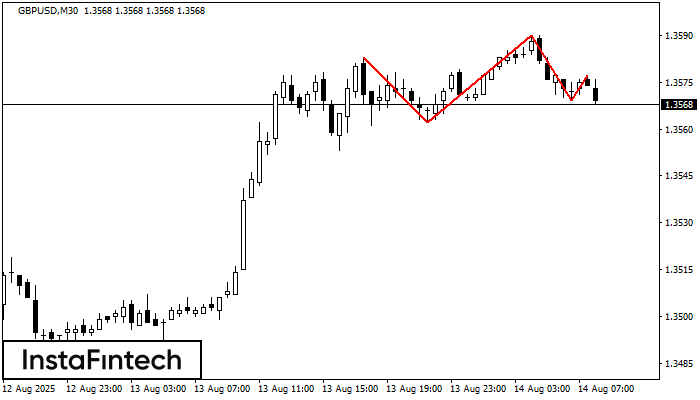
According to the chart of M30, GBPUSD formed the Head and Shoulders pattern. The Head’s top is set at 1.3590 while the median line of the Neck is found
Open chart in a new window


