


signal strength 1 of 5
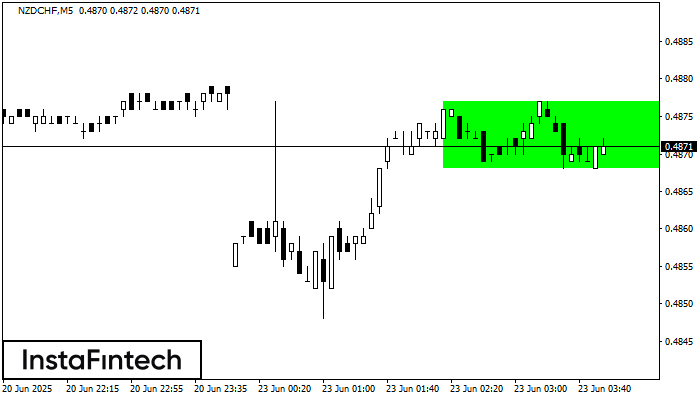
According to the chart of M5, NZDCHF formed the Bullish Rectangle which is a pattern of a trend continuation. The pattern is contained within the following borders: the lower border 0.4868 – 0.4868 and upper border 0.4877 – 0.4877. In case the upper border is broken, the instrument is likely to follow the upward trend.
The M5 and M15 time frames may have more false entry points.
See Also
- All
- Double Top
- Flag
- Head and Shoulders
- Pennant
- Rectangle
- Triangle
- Triple top
- All
- #AAPL
- #AMZN
- #Bitcoin
- #EBAY
- #FB
- #GOOG
- #INTC
- #KO
- #MA
- #MCD
- #MSFT
- #NTDOY
- #PEP
- #TSLA
- #TWTR
- AUDCAD
- AUDCHF
- AUDJPY
- AUDUSD
- EURCAD
- EURCHF
- EURGBP
- EURJPY
- EURNZD
- EURRUB
- EURUSD
- GBPAUD
- GBPCHF
- GBPJPY
- GBPUSD
- GOLD
- NZDCAD
- NZDCHF
- NZDJPY
- NZDUSD
- SILVER
- USDCAD
- USDCHF
- USDJPY
- USDRUB
- All
- M5
- M15
- M30
- H1
- D1
- All
- Buy
- Sale
- All
- 1
- 2
- 3
- 4
- 5
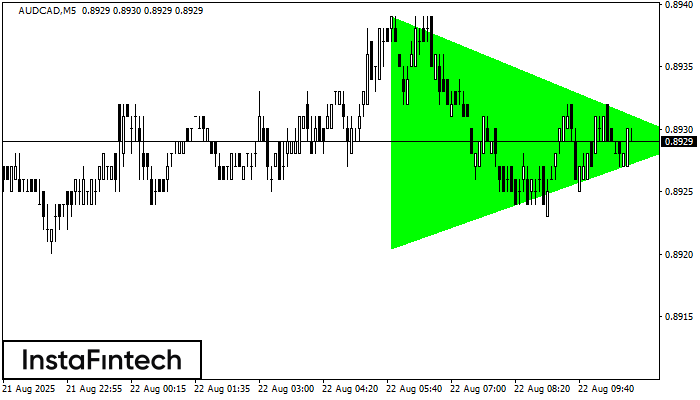
Según el gráfico de M5, el AUDCAD formó el patrón Triángulo Simétrico Alcista. El límite inferior del patrón toca las coordenadas 0.8920/0.8929 donde el límite superior cruza 0.8939/0.8929
Los marcos de tiempo M5 y M15 pueden tener más puntos de entrada falsos.
Open chart in a new window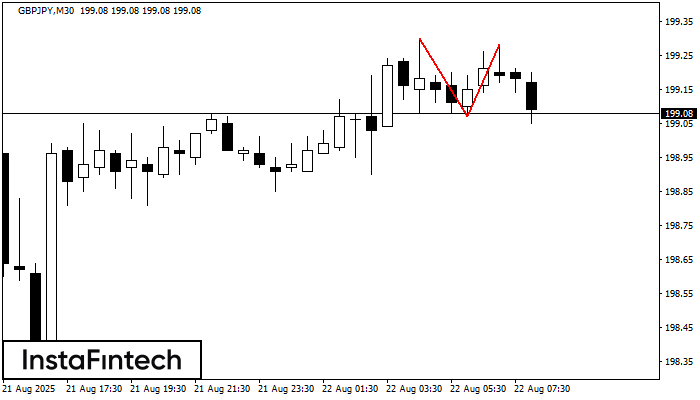
El patrón de reversión Doble Techo ha sido formado en GBPJPY M30. Características: el límite superior 199.30; el límite inferior 199.07; el ancho del patrón es 21 puntos. Es mejor
Open chart in a new window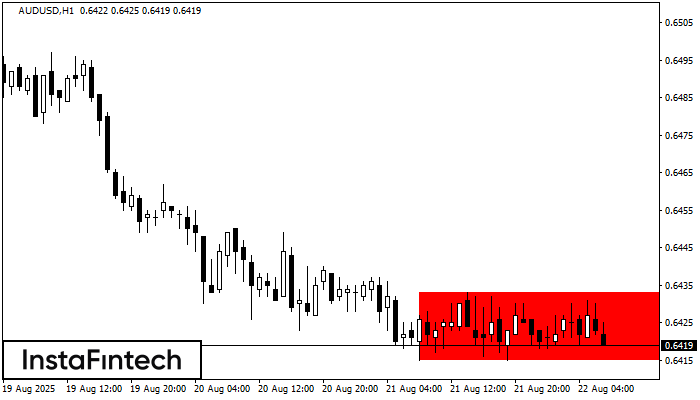
Según el gráfico de H1, AUDUSD formó el Rectángulo Bajista. El patrón indica la continuación de una tendencia. El límite superior es 0.6433, el límite inferior es 0.6415. La señal
Open chart in a new window


