

signal strength 2 of 5

The Bullish Flag pattern has been formed on EURJPY at M15. The lower boundary of the pattern is located at 163.36/163.14, while the higher boundary lies at 163.60/163.38. The projection of the flagpole is 62 points. This formation signals that the upward trend is most likely to continue. Therefore, if the level of 163.60 is broken, the price will move further upwards.
The M5 and M15 time frames may have more false entry points.
See Also
- All
- Double Top
- Flag
- Head and Shoulders
- Pennant
- Rectangle
- Triangle
- Triple top
- All
- #AAPL
- #AMZN
- #Bitcoin
- #EBAY
- #FB
- #GOOG
- #INTC
- #KO
- #MA
- #MCD
- #MSFT
- #NTDOY
- #PEP
- #TSLA
- #TWTR
- AUDCAD
- AUDCHF
- AUDJPY
- AUDUSD
- EURCAD
- EURCHF
- EURGBP
- EURJPY
- EURNZD
- EURRUB
- EURUSD
- GBPAUD
- GBPCHF
- GBPJPY
- GBPUSD
- GOLD
- NZDCAD
- NZDCHF
- NZDJPY
- NZDUSD
- SILVER
- USDCAD
- USDCHF
- USDJPY
- USDRUB
- All
- M5
- M15
- M30
- H1
- D1
- All
- Buy
- Sale
- All
- 1
- 2
- 3
- 4
- 5
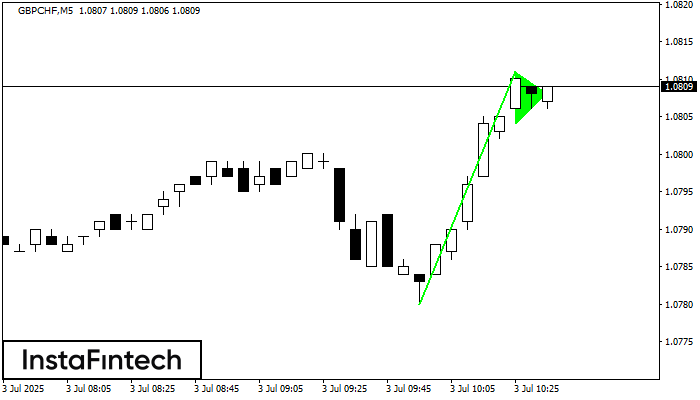
The Bullish pennant signal – Trading instrument GBPCHF M5, continuation pattern. Forecast: it is possible to set up a buy position above the pattern’s high of 1.0811, with the prospect
The M5 and M15 time frames may have more false entry points.
Open chart in a new window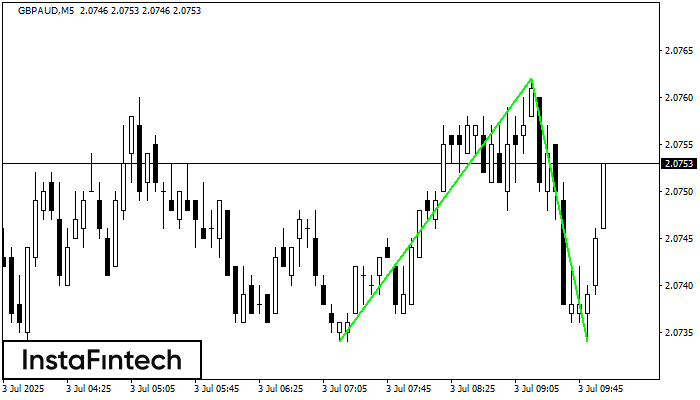
The Double Bottom pattern has been formed on GBPAUD M5. Characteristics: the support level 2.0734; the resistance level 2.0762; the width of the pattern 28 points. If the resistance level
The M5 and M15 time frames may have more false entry points.
Open chart in a new window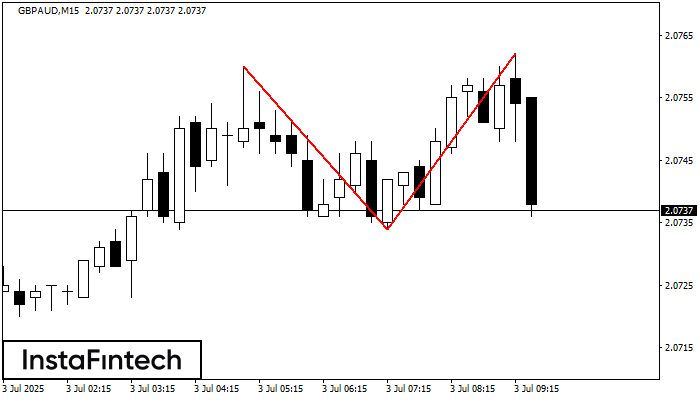
The Double Top reversal pattern has been formed on GBPAUD M15. Characteristics: the upper boundary 2.0760; the lower boundary 2.0734; the width of the pattern is 28 points. Sell trades
The M5 and M15 time frames may have more false entry points.
Open chart in a new window


